mLN EYFP+ all timepoints
A.DeMartin
2025-04-29
Last updated: 2025-07-15
Checks: 6 1
Knit directory: LNdevMouse24.2/
This reproducible R Markdown analysis was created with workflowr (version 1.7.1). The Checks tab describes the reproducibility checks that were applied when the results were created. The Past versions tab lists the development history.
The R Markdown is untracked by Git. To know which version of the R
Markdown file created these results, you’ll want to first commit it to
the Git repo. If you’re still working on the analysis, you can ignore
this warning. When you’re finished, you can run
wflow_publish to commit the R Markdown file and build the
HTML.
Great job! The global environment was empty. Objects defined in the global environment can affect the analysis in your R Markdown file in unknown ways. For reproduciblity it’s best to always run the code in an empty environment.
The command set.seed(20250625) was run prior to running
the code in the R Markdown file. Setting a seed ensures that any results
that rely on randomness, e.g. subsampling or permutations, are
reproducible.
Great job! Recording the operating system, R version, and package versions is critical for reproducibility.
Nice! There were no cached chunks for this analysis, so you can be confident that you successfully produced the results during this run.
Great job! Using relative paths to the files within your workflowr project makes it easier to run your code on other machines.
Great! You are using Git for version control. Tracking code development and connecting the code version to the results is critical for reproducibility.
The results in this page were generated with repository version 6788aae. See the Past versions tab to see a history of the changes made to the R Markdown and HTML files.
Note that you need to be careful to ensure that all relevant files for
the analysis have been committed to Git prior to generating the results
(you can use wflow_publish or
wflow_git_commit). workflowr only checks the R Markdown
file, but you know if there are other scripts or data files that it
depends on. Below is the status of the Git repository when the results
were generated:
Ignored files:
    Ignored:    .DS_Store
    Ignored:    .Rhistory
    Ignored:    .Rproj.user/
    Ignored:    analysis/.DS_Store

Untracked files:
    Untracked:  analysis/mLNEYFPpos.Rmd
    Untracked:  analysis/tradeSeq.Rmd
Note that any generated files, e.g. HTML, png, CSS, etc., are not included in this status report because it is ok for generated content to have uncommitted changes.
There are no past versions. Publish this analysis with
wflow_publish() to start tracking its development.
load packages
library(ExploreSCdataSeurat3)
library(runSeurat3)
library(Seurat)
library(ggpubr)
library(pheatmap)
library(SingleCellExperiment)
library(dplyr)
library(tidyverse)
library(viridis)
library(muscat)
library(circlize)
library(destiny)
library(scater)
library(metap)
library(multtest)
library(clusterProfiler)
library(org.Hs.eg.db)
library(msigdbr)
library(enrichplot)
library(DOSE)
library(grid)
library(gridExtra)
library(ggupset)
library(VennDiagram)
library(NCmisc)
library(slingshot)
library(RColorBrewer)
library(here)
preprocessing
load object all
basedir <- here()
fileNam <- paste0(basedir, "/data/LNmLToRev_allmerged_seurat.rds")
seuratM <- readRDS(fileNam)
table(seuratM$dataset)
    380131_02-2_20250224_Cxcl13EYFP_P7_iLN_YFPneg     380131_03-3_20250224_Cxcl13EYFP_P7_iLN_YFPpos
                                             5138                                              3906
    380131_04-4_20250224_Cxcl13EYFP_P7_mLN_YFPpos     380131_05-5_20250224_Cxcl13EYFP_P7_mLN_YFPneg
                                             8203                                              6337
      380131_06-6_20250225_Cxcl13EYFP_E18_iLN_fib    380131_07-7_20250225_Cxcl13EYFP_E18_mLN_YFPpos
                                             5362                                              5438
   380131_08-8_20250225_Cxcl13EYFP_E18_mLN_YFPneg 380131_11-11_20250305_Mu_Cxcl13EYFP_Adult_pLN_FRC
                                             5449                                              5344
380131_12-12_20250305_Mu_Cxcl13EYFP_Adult_mLN_FRC    382581_01-1_20250311_Mu_Cxcl13EYFP_E18_iLN_fib
                                             6746                                              4035
382581_02-2_20250311_Mu_Cxcl13EYFP_E18_mLN_YFPpos 382581_03-3_20250311_Mu_Cxcl13EYFP_E18_mLN_YFPneg
                                             8101                                             14326
 382581_04-4_20250319_Mu_Cxcl13EYFP_P7_iLN_YFPpos  382581_05-5_20250319_Mu_Cxcl13EYFP_P7_iLN_YFPneg
                                             3107                                              5161
 382581_06-6_20250319_Mu_Cxcl13EYFP_P7_mLN_YFPpos  382581_07-7_20250319_Mu_Cxcl13EYFP_P7_mLN_YFPneg
                                             8557                                              4427
 382581_08-8_20250320_Mu_Cxcl13EYFP_Adult_pLN_FRC  382581_09-9_20250320_Mu_Cxcl13EYFP_Adult_mLN_FRC
                                             7338                                              3739
 382581_12-12_20250402_Mu_Cxcl13EYFP_3wk_iLN_fib1  382581_13-13_20250402_Mu_Cxcl13EYFP_3wk_iLN_fib2
                                             6689                                              8423
 382581_14-14_20250402_Mu_Cxcl13EYFP_3wk_mLN_fib1  382581_15-15_20250402_Mu_Cxcl13EYFP_3wk_mLN_fib2
                                             6477                                              7988
table(seuratM$RNA_snn_res.0.25)
    0     1     2     3     4     5     6     7     8     9    10    11    12    13    14    15
26907 18102 16879 15100 12710  7758  6842  6775  5471  5456  5030  3609  2710  1779  1650   958
   16    17    18    19
  851   829   508   367
table(seuratM$orig.ident)
140291 subset EYFP+
seuratSub <- subset(seuratM, Rosa26eyfp.Rosa26eyfp>0)
eyfpPos <- colnames(seuratSub)

seuratM$EYFP <-"neg"
seuratM$EYFP[which(colnames(seuratM)%in%eyfpPos)] <- "pos"

table(seuratM$dataset, seuratM$EYFP)

seuratEYFP <- subset(seuratM, EYFP == "pos")
table(seuratEYFP$orig.ident)

## rerun seurat
seuratEYFP <- NormalizeData (object = seuratEYFP)
seuratEYFP <- FindVariableFeatures(object = seuratEYFP)
seuratEYFP <- ScaleData(object = seuratEYFP, verbose = TRUE)
seuratEYFP <- RunPCA(object=seuratEYFP, npcs = 30, verbose = FALSE)
seuratEYFP <- RunTSNE(object=seuratEYFP, reduction="pca", dims = 1:20)
seuratEYFP <- RunUMAP(object=seuratEYFP, reduction="pca", dims = 1:20)
seuratEYFP <- FindNeighbors(object = seuratEYFP, reduction = "pca", dims= 1:20)

res <- c(0.25, 0.6, 0.8, 0.4)
for (i in 1:length(res)) {
  seuratEYFP <- FindClusters(object = seuratEYFP, resolution = res[i], random.seed = 1234)
}
## save object
saveRDS(seuratEYFP, file=paste0(basedir,"/data/LNmLToRev_EYFPonly_seurat.rds"))load object EYFP+
fileNam <- paste0(basedir, "/data/LNmLToRev_EYFPonly_seurat.rds")
seuratEYFP <- readRDS(fileNam)
table(seuratEYFP$dataset)
    380131_02-2_20250224_Cxcl13EYFP_P7_iLN_YFPneg     380131_03-3_20250224_Cxcl13EYFP_P7_iLN_YFPpos
                                               73                                              3026
    380131_04-4_20250224_Cxcl13EYFP_P7_mLN_YFPpos     380131_05-5_20250224_Cxcl13EYFP_P7_mLN_YFPneg
                                             4780                                                24
      380131_06-6_20250225_Cxcl13EYFP_E18_iLN_fib    380131_07-7_20250225_Cxcl13EYFP_E18_mLN_YFPpos
                                              165                                              3604
   380131_08-8_20250225_Cxcl13EYFP_E18_mLN_YFPneg 380131_11-11_20250305_Mu_Cxcl13EYFP_Adult_pLN_FRC
                                               13                                              3424
380131_12-12_20250305_Mu_Cxcl13EYFP_Adult_mLN_FRC    382581_01-1_20250311_Mu_Cxcl13EYFP_E18_iLN_fib
                                             3951                                              1095
382581_02-2_20250311_Mu_Cxcl13EYFP_E18_mLN_YFPpos 382581_03-3_20250311_Mu_Cxcl13EYFP_E18_mLN_YFPneg
                                             5457                                                29
 382581_04-4_20250319_Mu_Cxcl13EYFP_P7_iLN_YFPpos  382581_05-5_20250319_Mu_Cxcl13EYFP_P7_iLN_YFPneg
                                             2689                                                99
 382581_06-6_20250319_Mu_Cxcl13EYFP_P7_mLN_YFPpos  382581_07-7_20250319_Mu_Cxcl13EYFP_P7_mLN_YFPneg
                                             6111                                                23
 382581_08-8_20250320_Mu_Cxcl13EYFP_Adult_pLN_FRC  382581_09-9_20250320_Mu_Cxcl13EYFP_Adult_mLN_FRC
                                             4279                                              2829
 382581_12-12_20250402_Mu_Cxcl13EYFP_3wk_iLN_fib1  382581_13-13_20250402_Mu_Cxcl13EYFP_3wk_iLN_fib2
                                             3261                                              3590
 382581_14-14_20250402_Mu_Cxcl13EYFP_3wk_mLN_fib1  382581_15-15_20250402_Mu_Cxcl13EYFP_3wk_mLN_fib2
                                             3809                                              5297
table(seuratEYFP$RNA_snn_res.0.25)
    0     1     2     3     4     5     6     7     8     9    10    11    12    13
13255  7957  7189  5621  4892  4822  4378  2353  1924  1732  1005   945   855   700
table(seuratEYFP$orig.ident)
57628 subset mLN
## subset
table(seuratEYFP$location)
seuratmLN <- subset(seuratEYFP, location == "mLN")
table(seuratmLN$orig.ident)

## rerun seurat
seuratmLN <- NormalizeData (object = seuratmLN)
seuratmLN <- FindVariableFeatures(object = seuratmLN)
seuratmLN <- ScaleData(object = seuratmLN, verbose = TRUE)
seuratmLN <- RunPCA(object=seuratmLN, npcs = 30, verbose = FALSE)
seuratmLN <- RunTSNE(object=seuratmLN, reduction="pca", dims = 1:20)
seuratmLN <- RunUMAP(object=seuratmLN, reduction="pca", dims = 1:20)
seuratmLN <- FindNeighbors(object = seuratmLN, reduction = "pca", dims= 1:20)

res <- c(0.25, 0.6, 0.8, 0.4)
for (i in 1:length(res)) {
  seuratmLN <- FindClusters(object = seuratmLN, resolution = res[i], random.seed = 1234)
}
### save object
saveRDS(seuratmLN, file=paste0(basedir,"/data/LNmLToRev_EYFP_mLN_seurat.rds"))load object mLN EYFP+
fileNam <- paste0(basedir, "/data/LNmLToRev_EYFP_mLN_seurat.rds")
seuratmLN <- readRDS(fileNam)
table(seuratmLN$dataset)
    380131_04-4_20250224_Cxcl13EYFP_P7_mLN_YFPpos     380131_05-5_20250224_Cxcl13EYFP_P7_mLN_YFPneg
                                             4780                                                24
   380131_07-7_20250225_Cxcl13EYFP_E18_mLN_YFPpos    380131_08-8_20250225_Cxcl13EYFP_E18_mLN_YFPneg
                                             3604                                                13
380131_12-12_20250305_Mu_Cxcl13EYFP_Adult_mLN_FRC 382581_02-2_20250311_Mu_Cxcl13EYFP_E18_mLN_YFPpos
                                             3951                                              5457
382581_03-3_20250311_Mu_Cxcl13EYFP_E18_mLN_YFPneg  382581_06-6_20250319_Mu_Cxcl13EYFP_P7_mLN_YFPpos
                                               29                                              6111
 382581_07-7_20250319_Mu_Cxcl13EYFP_P7_mLN_YFPneg  382581_09-9_20250320_Mu_Cxcl13EYFP_Adult_mLN_FRC
                                               23                                              2829
 382581_14-14_20250402_Mu_Cxcl13EYFP_3wk_mLN_fib1  382581_15-15_20250402_Mu_Cxcl13EYFP_3wk_mLN_fib2
                                             3809                                              5297
table(seuratmLN$RNA_snn_res.0.25)
   0    1    2    3    4    5    6    7    8    9   10   11   12   13
8201 5773 4993 4725 3803 1887 1706 1582  866  692  638  603  388   70
table(seuratmLN$orig.ident)
35927 set color vectors
coltimepoint <- c("#440154FF", "#3B528BFF", "#21908CFF", "#5DC863FF")
names(coltimepoint) <- c("E18", "P7", "3w", "8w")

colPal <- c("#DAF7A6", "#FFC300", "#FF5733", "#C70039", "#900C3F", "#b66e8d",
            "#61a4ba", "#6178ba", "#54a87f",  "#25328a",
            "#b6856e", "#0073C2FF", "#EFC000FF", "#868686FF", "#CD534CFF",
            "#7AA6DCFF", "#003C67FF", "#8F7700FF", "#3B3B3BFF", "#A73030FF",
            "#4A6990FF")[1:length(unique(seuratmLN$RNA_snn_res.0.4))]
names(colPal) <- unique(seuratmLN$RNA_snn_res.0.4)

collocation <- c("#61baba", "#ba6161")
names(collocation) <- c("iLN", "mLN")
dimplot
clustering
DimPlot(seuratmLN, reduction = "umap", group.by = "RNA_snn_res.0.4",
        cols = colPal, label = TRUE)+
  theme_bw() +
  theme(axis.text = element_blank(), axis.ticks = element_blank(),
        panel.grid.minor = element_blank()) +
  xlab("UMAP1") +
  ylab("UMAP2")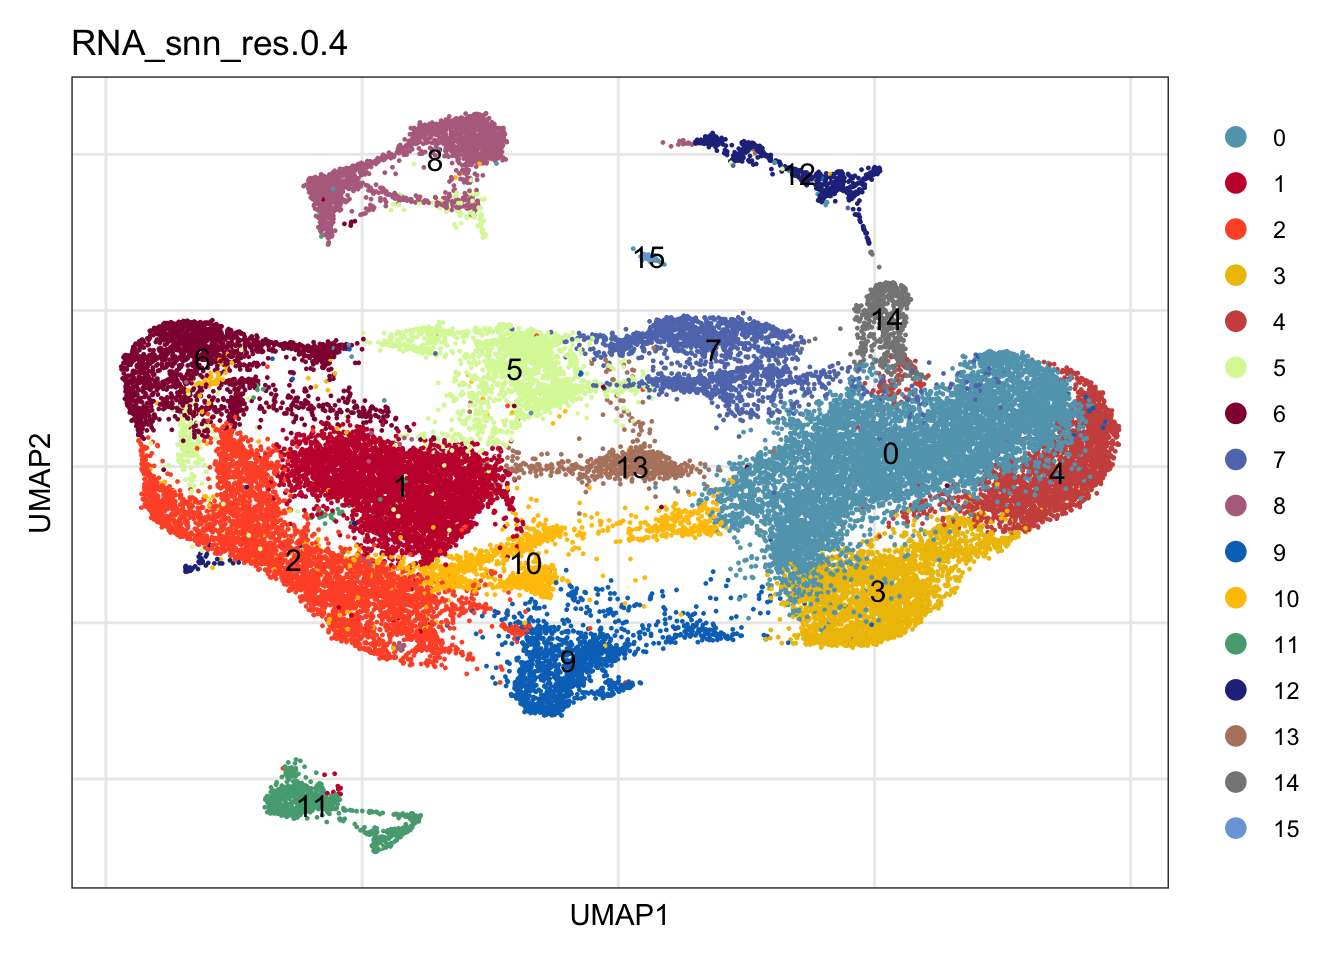
timepoint
DimPlot(seuratmLN, reduction = "umap", group.by = "timepoint",
        cols = coltimepoint)+
  theme_bw() +
  theme(axis.text = element_blank(), axis.ticks = element_blank(),
        panel.grid.minor = element_blank()) +
  xlab("UMAP1") +
  ylab("UMAP2")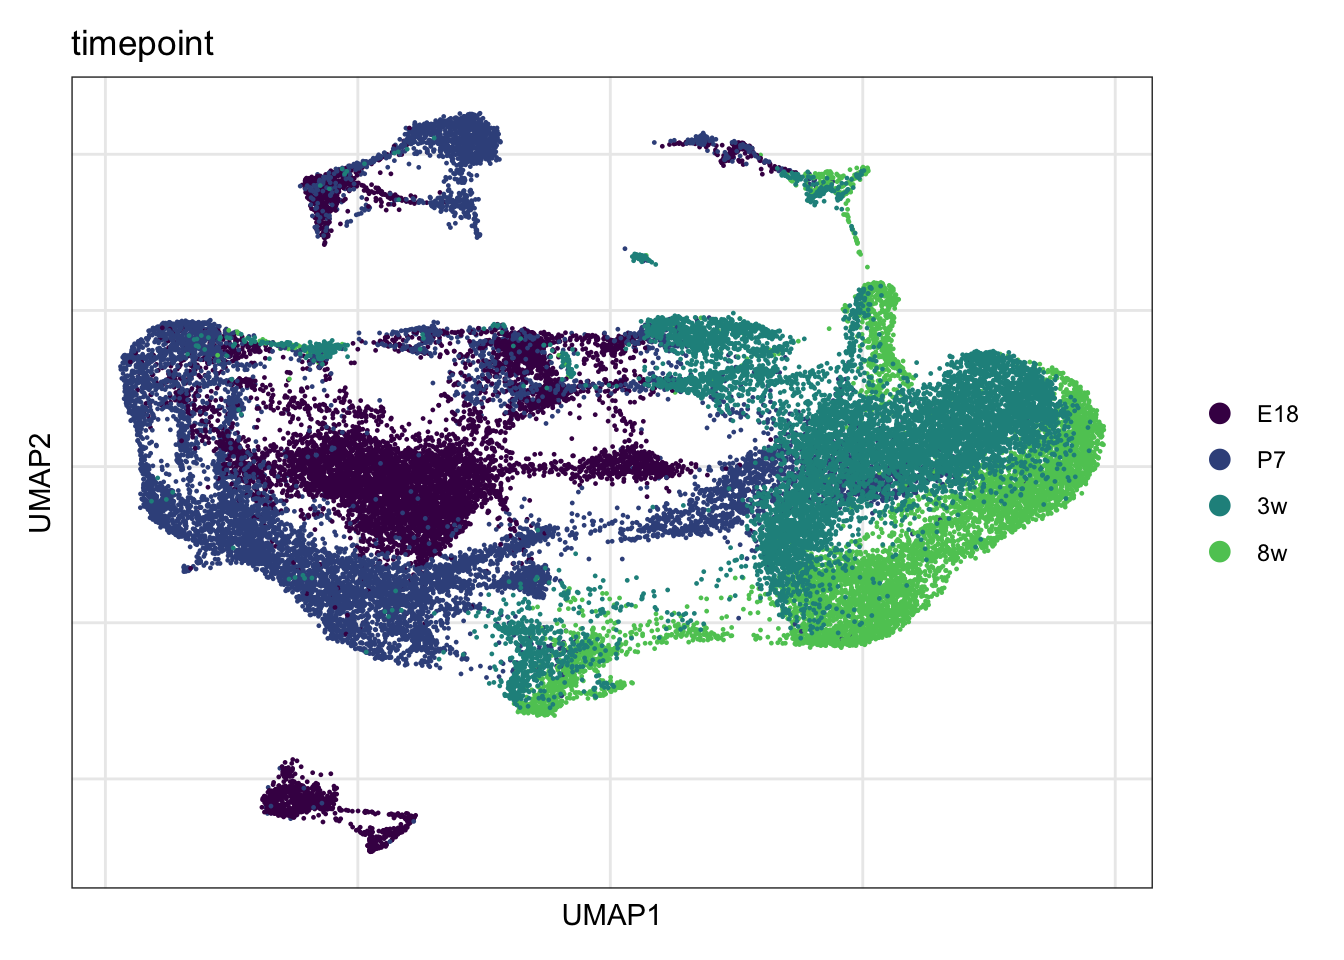
calculate cluster marker genes
## cluster marker
Idents(seuratmLN) <- seuratmLN$RNA_snn_res.0.4
markerGenes <- FindAllMarkers(seuratmLN, only.pos=T) %>%
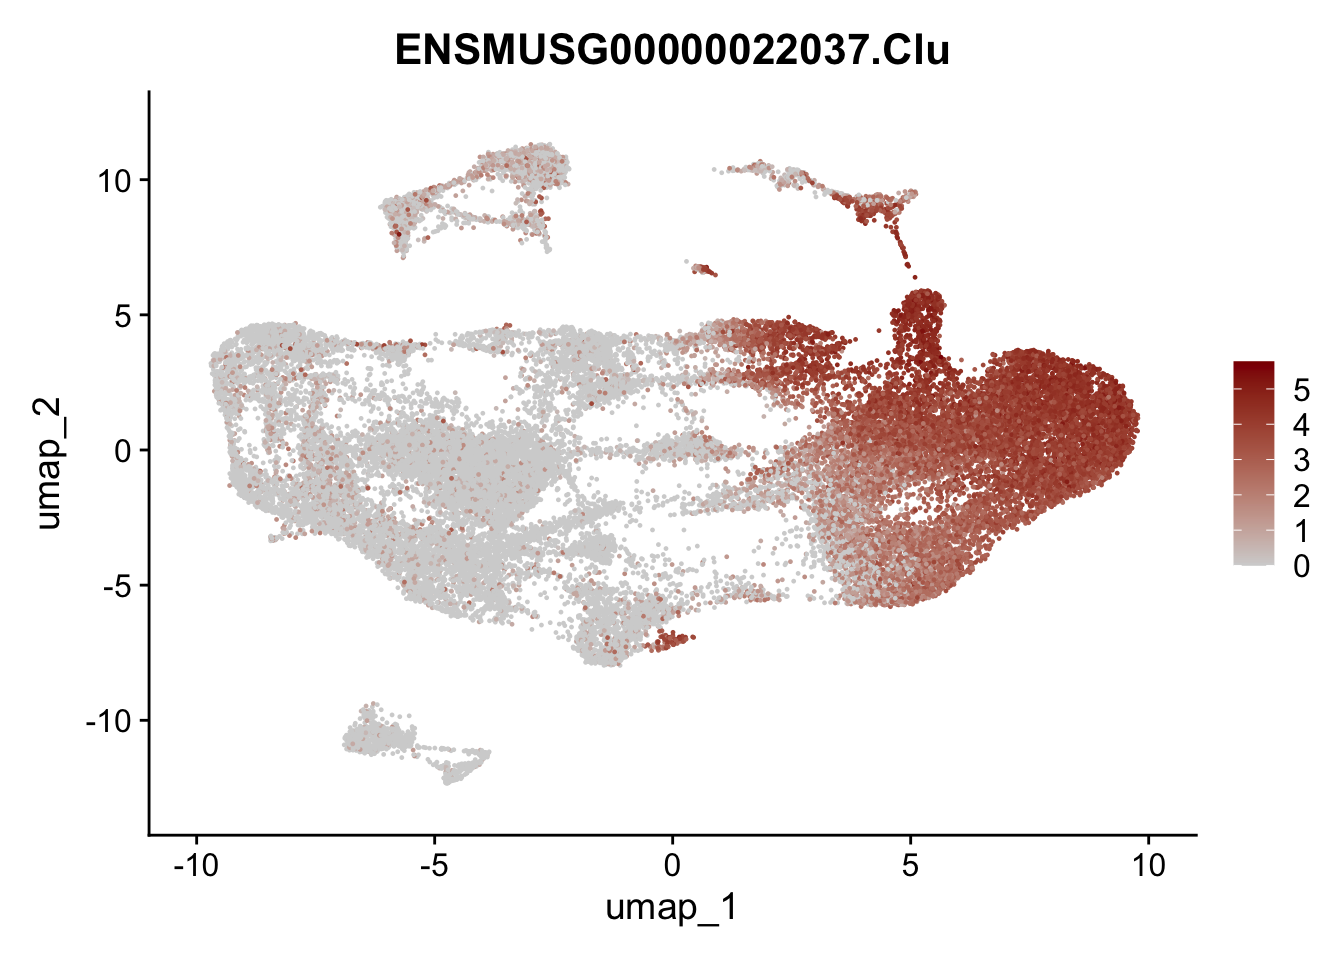
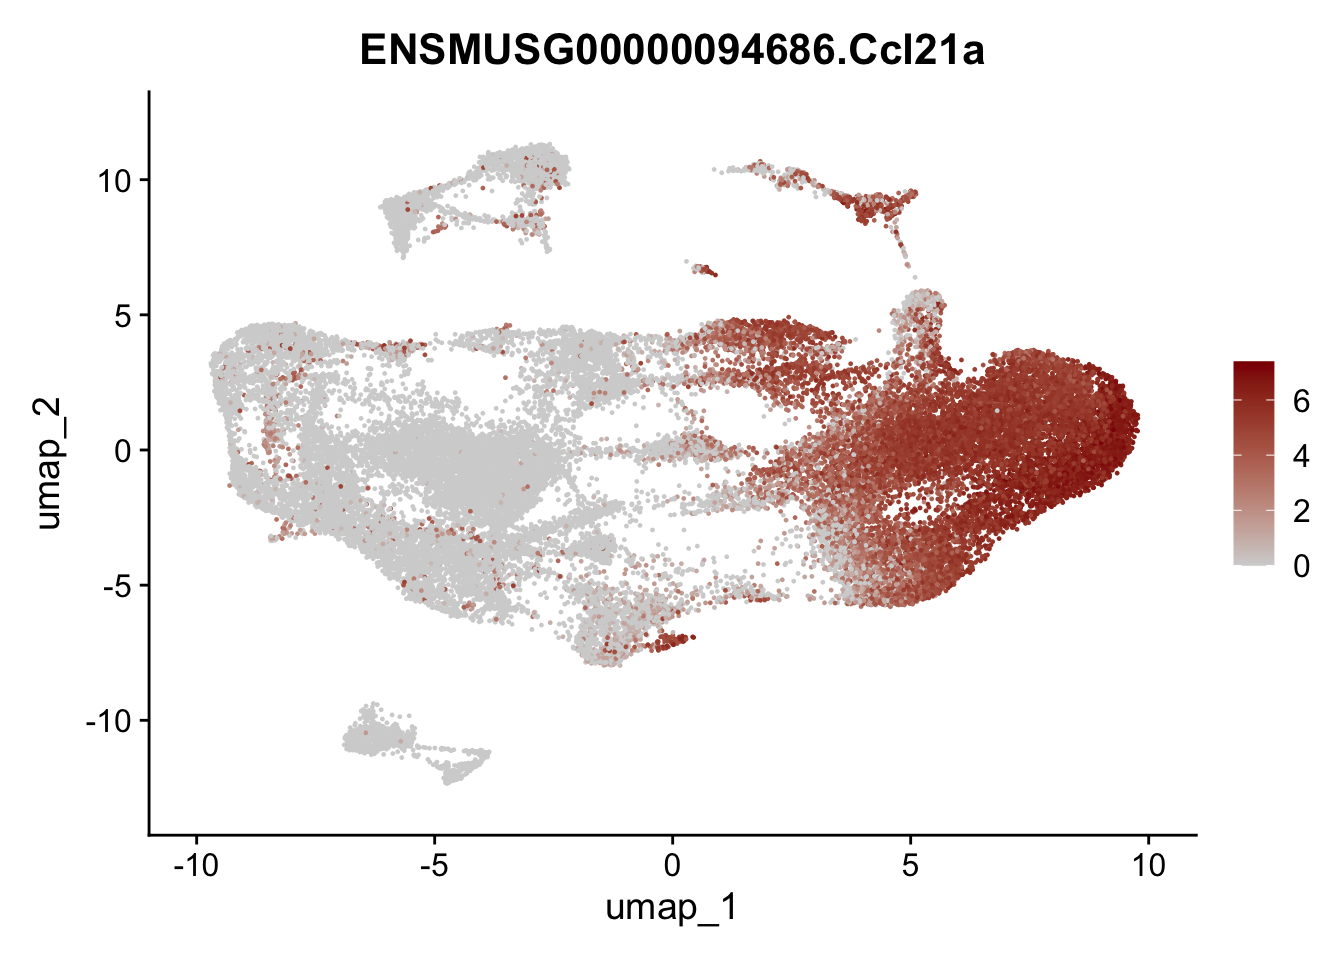
dplyr::filter(p_val_adj < 0.01)features
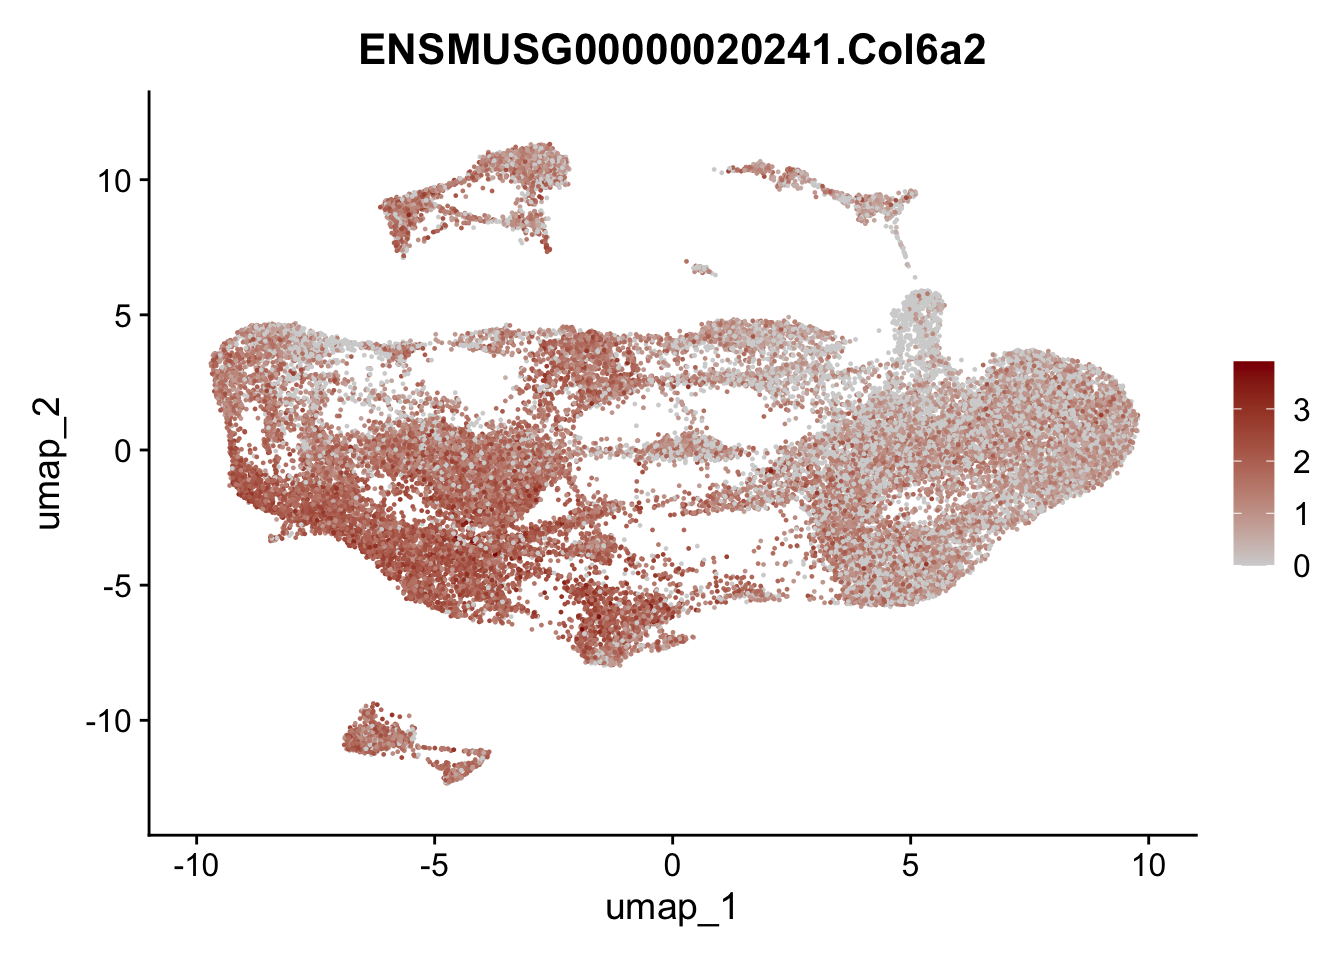
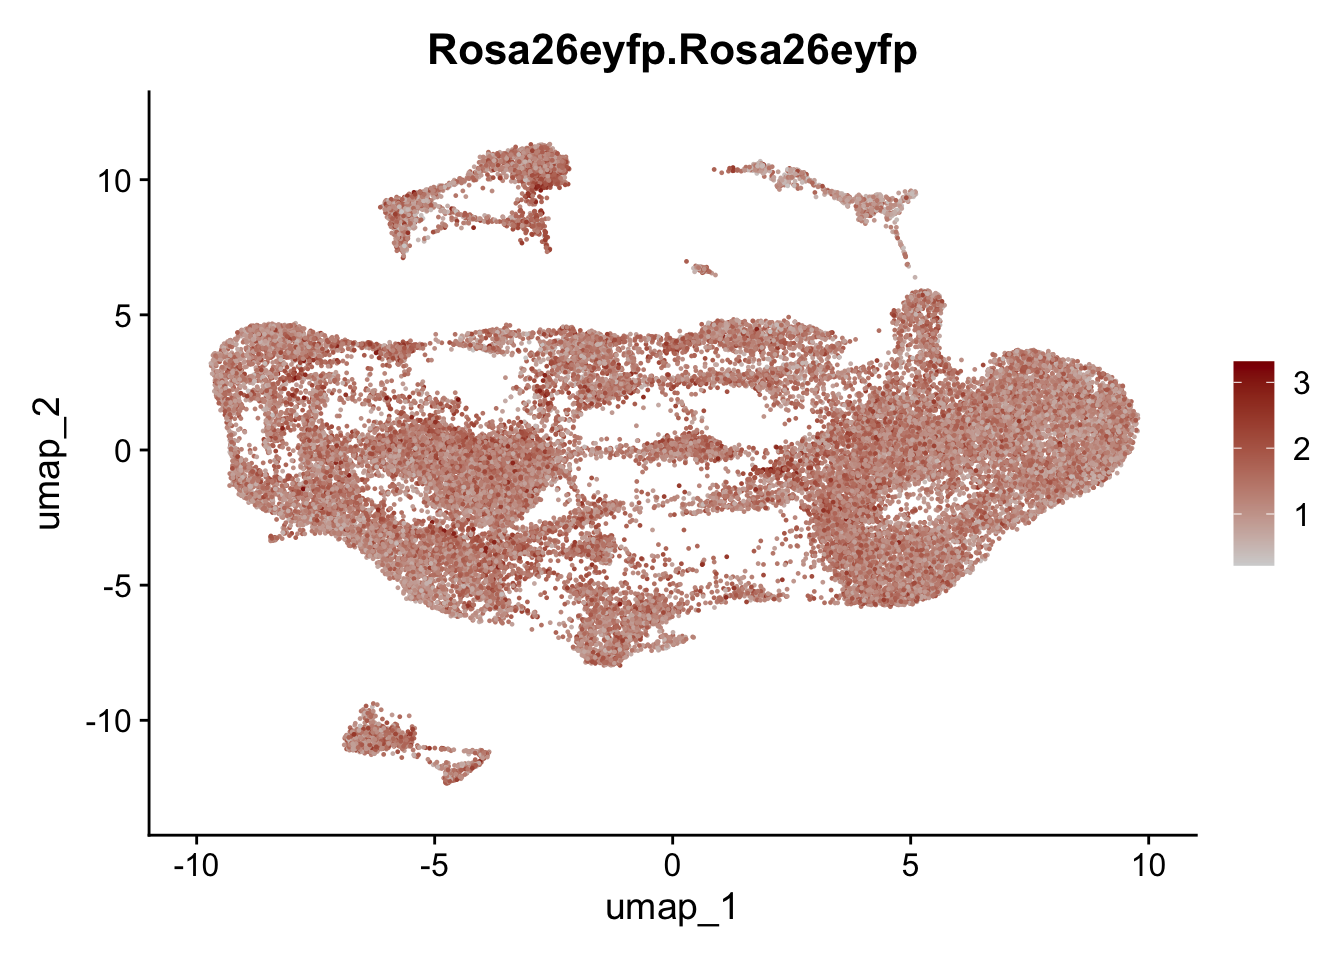
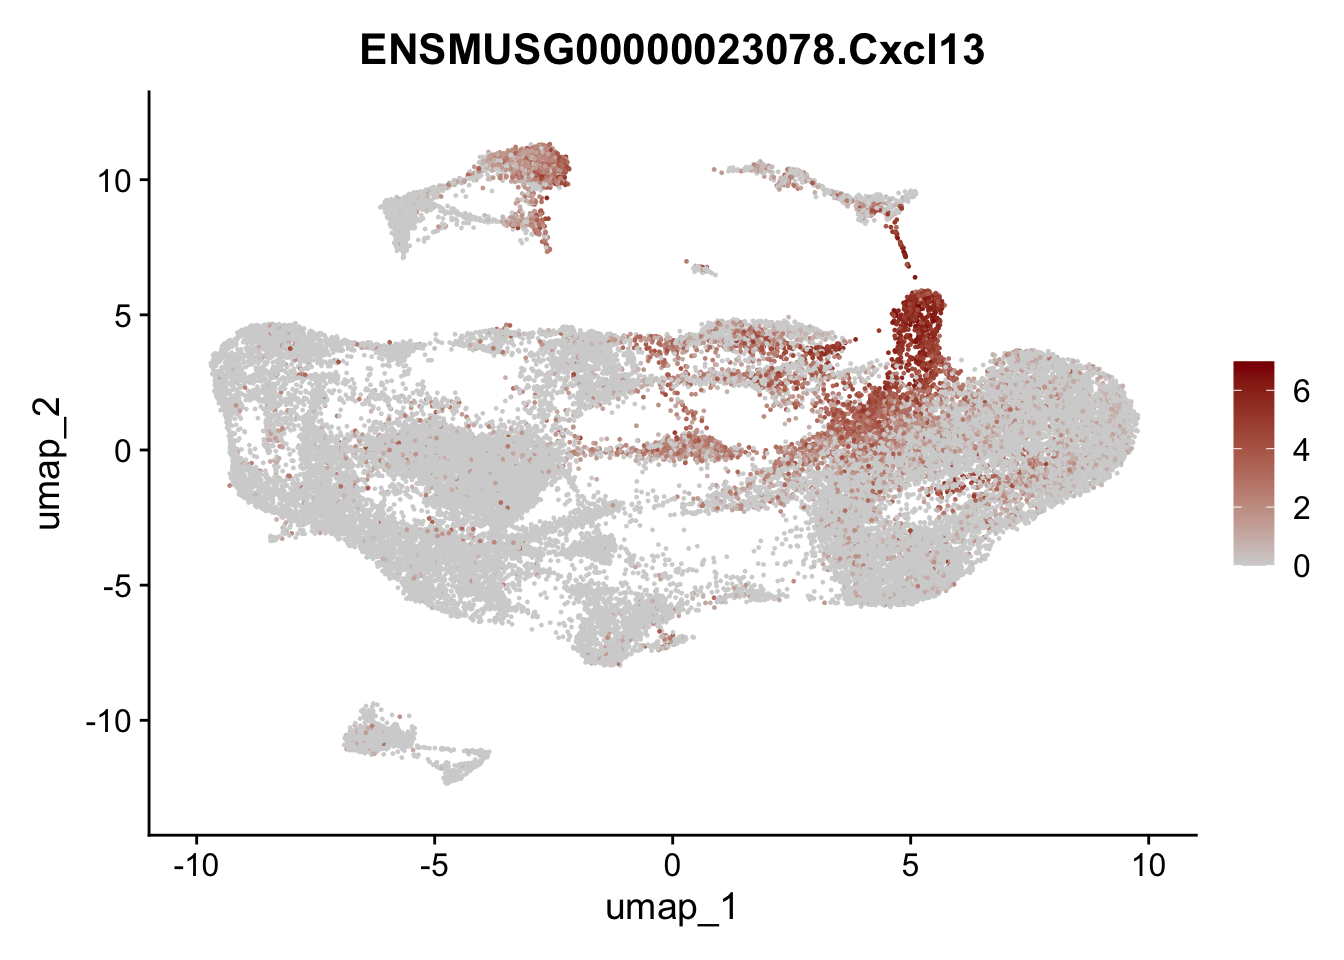
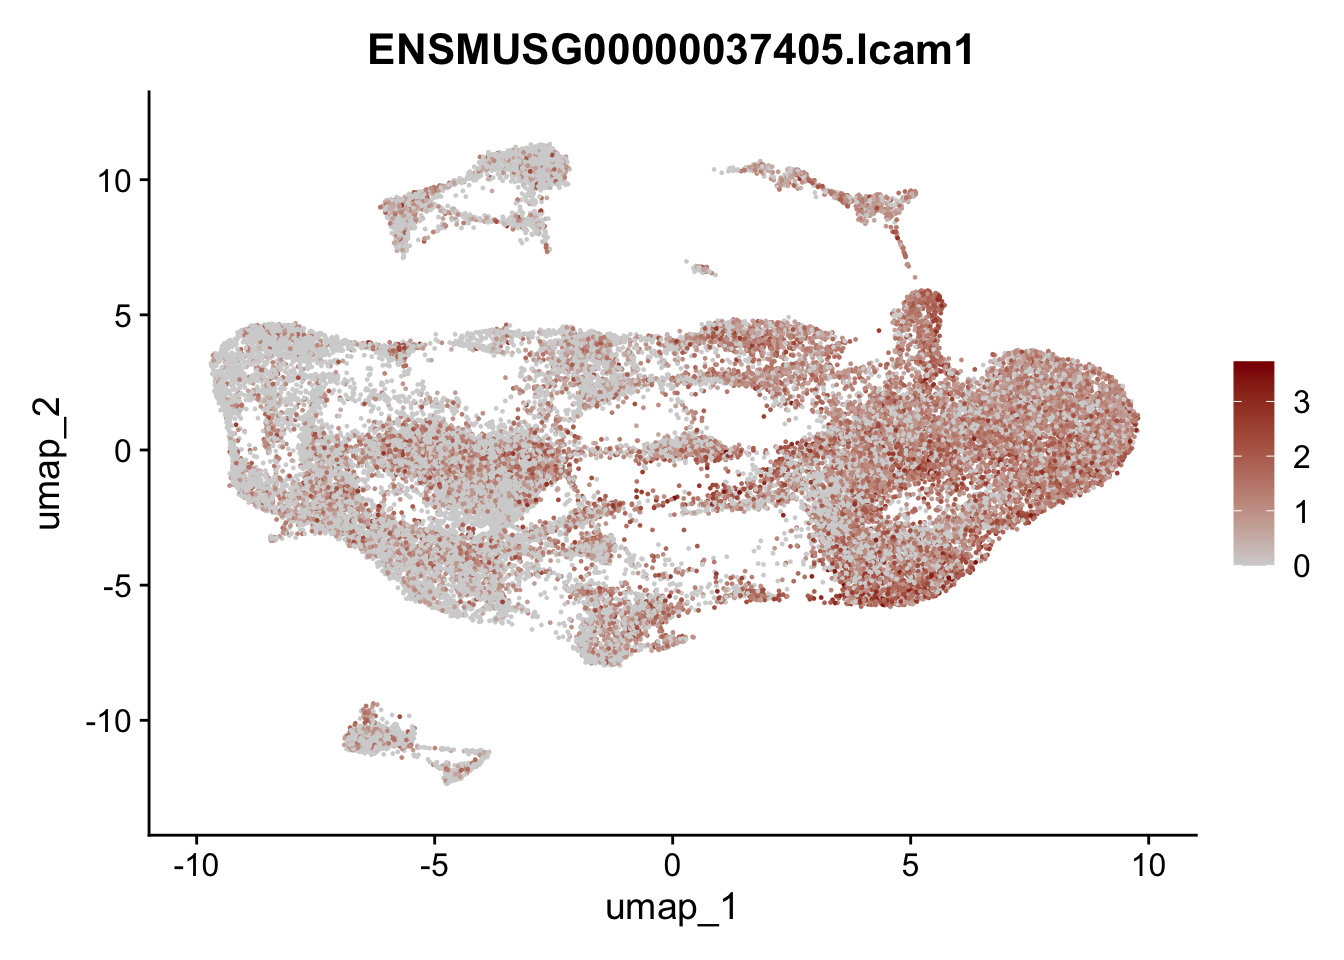
genes <- data.frame(gene=rownames(seuratmLN)) %>%
mutate(geneID=gsub("^.*\\.", "", gene))
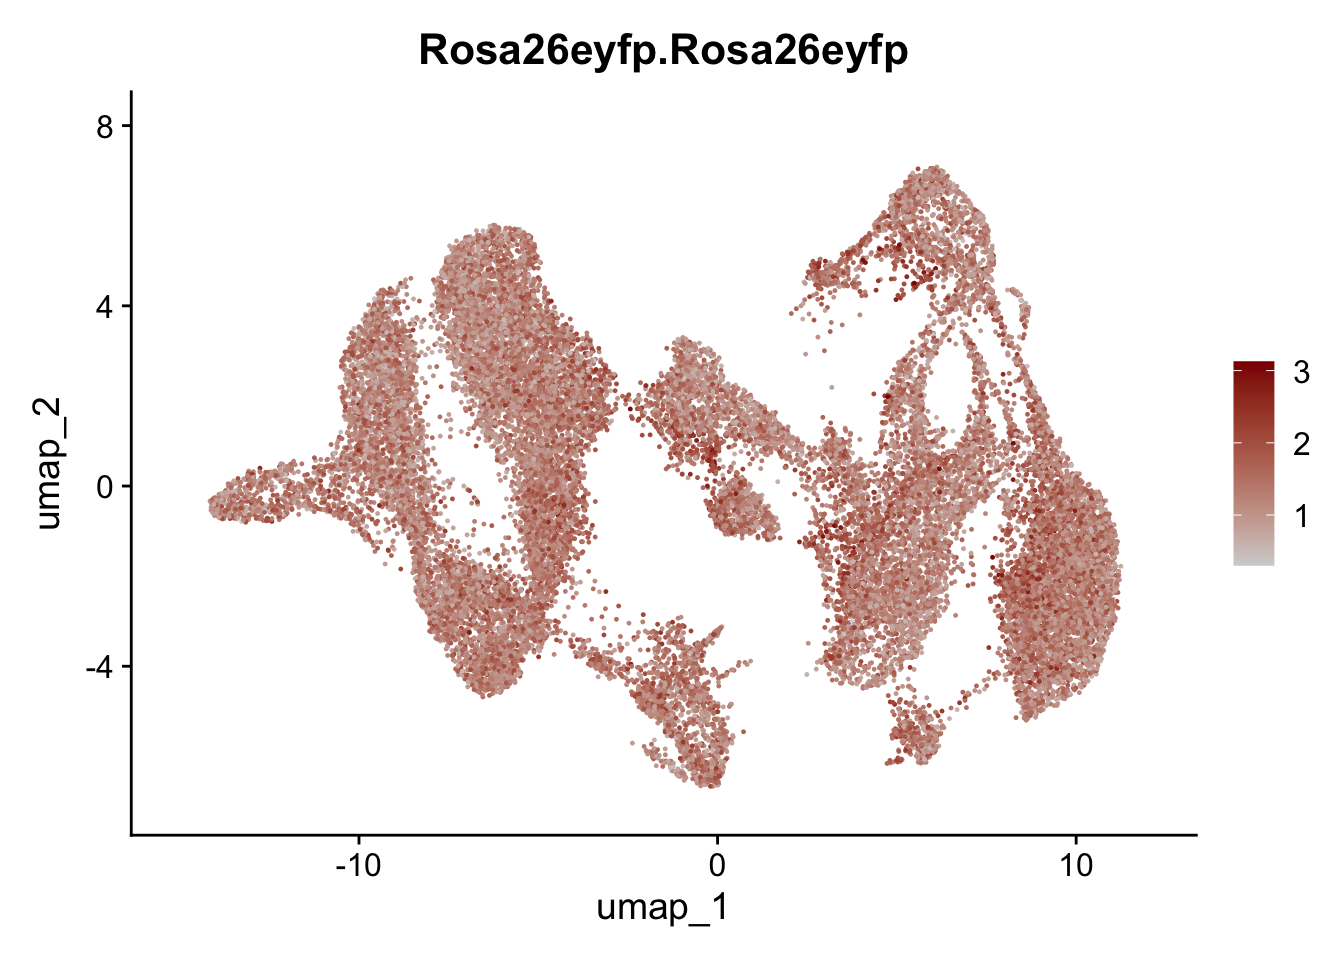
selGenesAll <- data.frame(geneID=c("Clu", "Ccl21a", "Grem1", "Grem2","Mfap4", "Ccl19","Cd34", "Col6a1",
"Col6a2","Rosa26eyfp", "Cxcl13", "Icam1", "Vcam1")) %>%
left_join(., genes, by = "geneID")
pList <- sapply(selGenesAll$gene, function(x){
p <- FeaturePlot(seuratmLN, reduction = "umap",
features = x,
cols=c("lightgrey", "darkred"),
order = F)+
theme(legend.position="right")
plot(p)
})


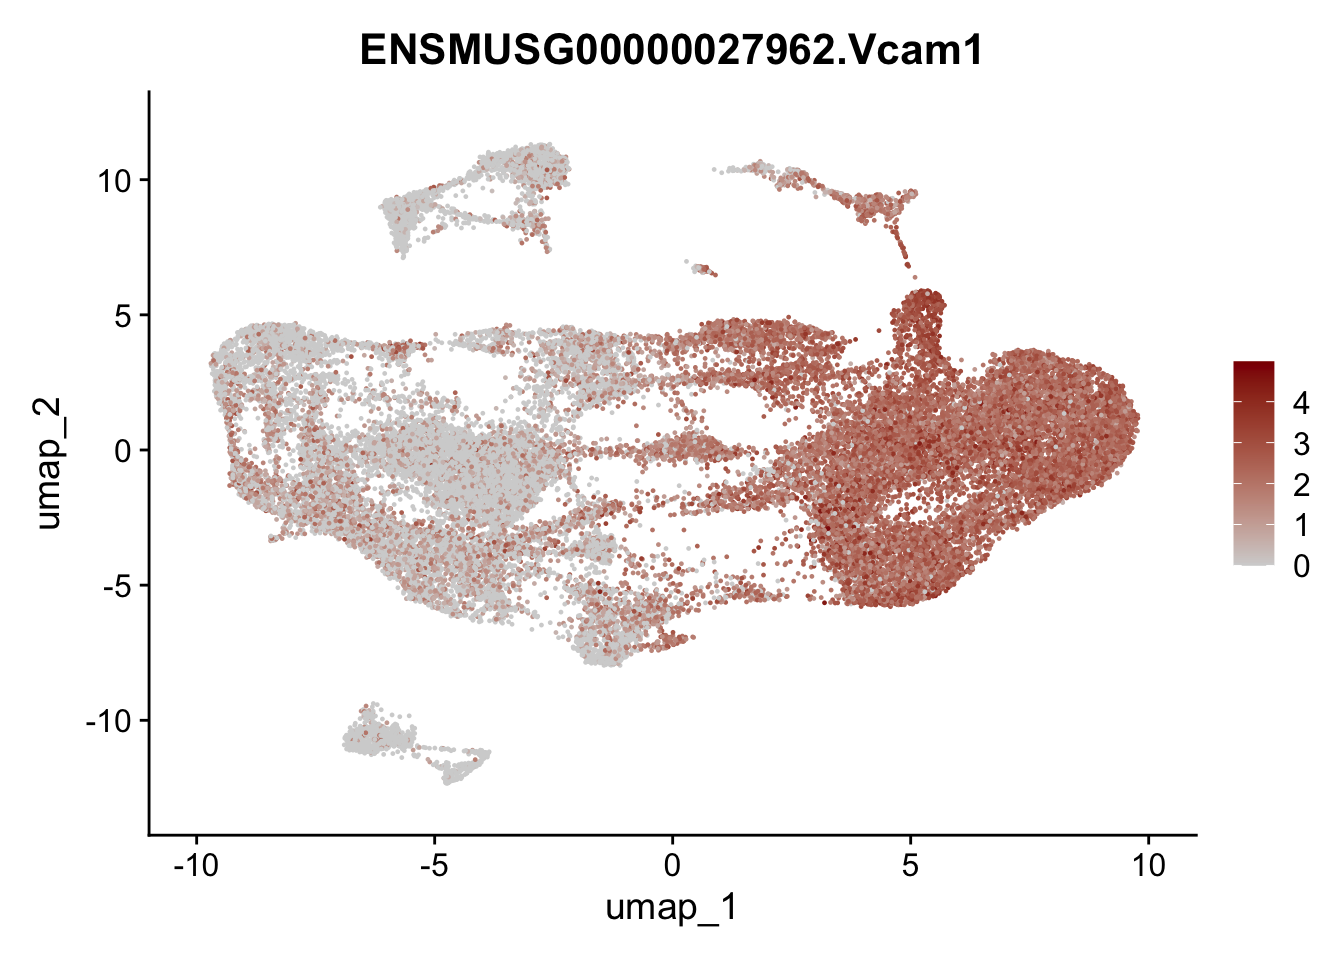
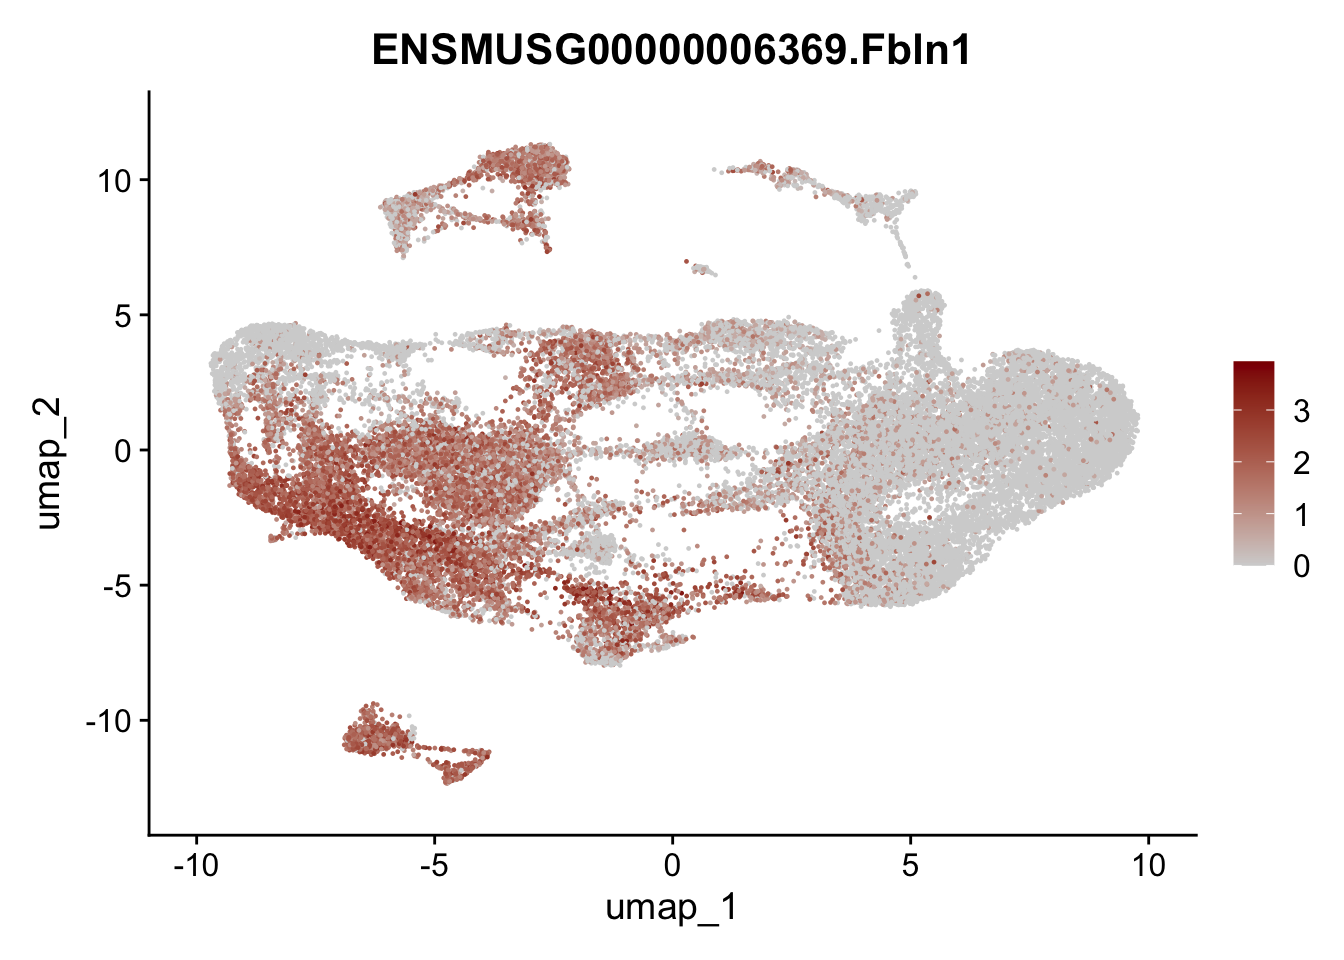
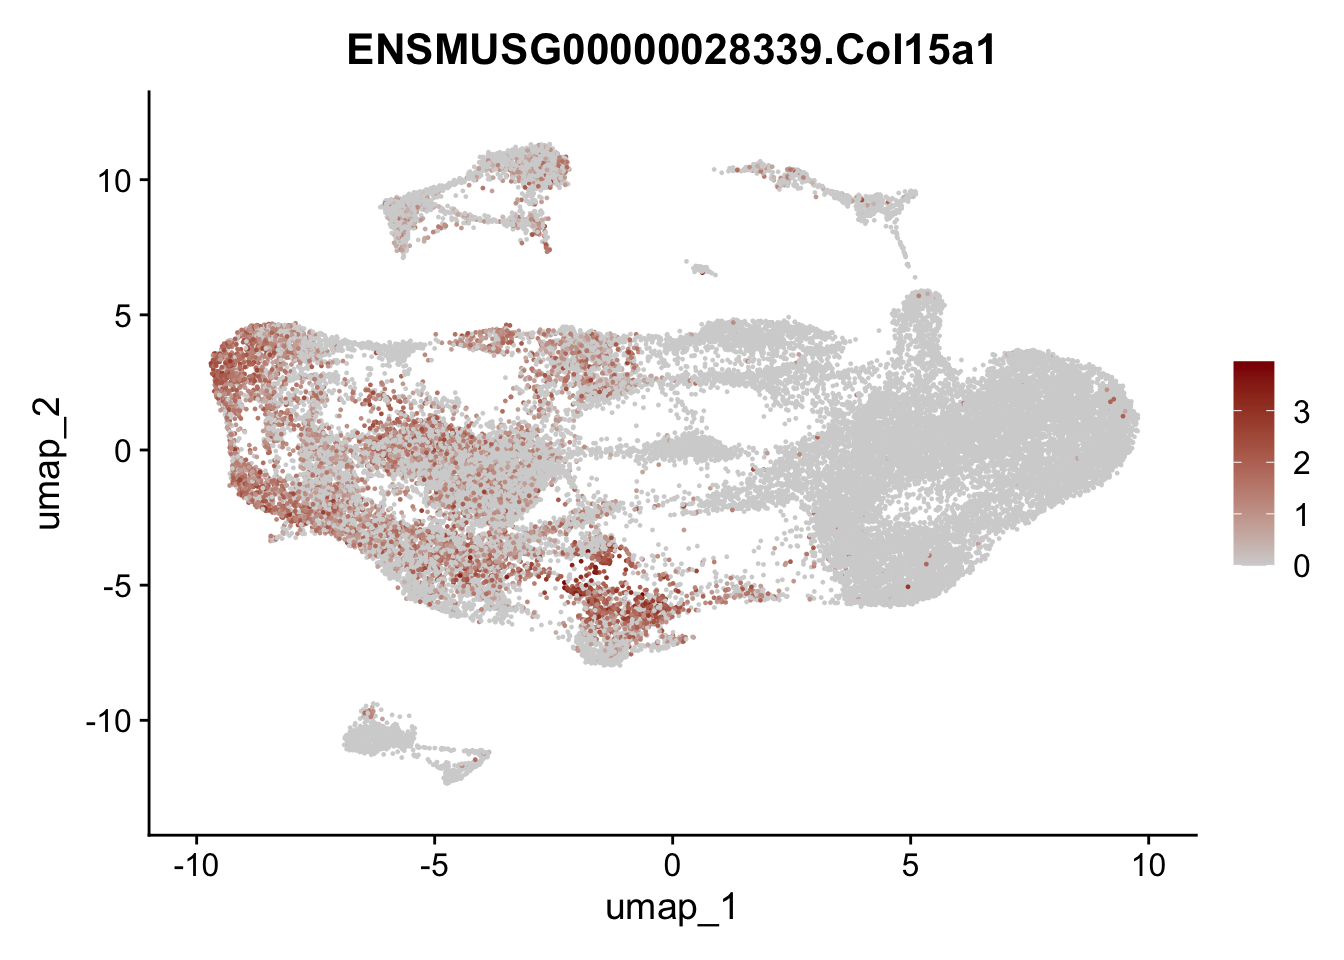
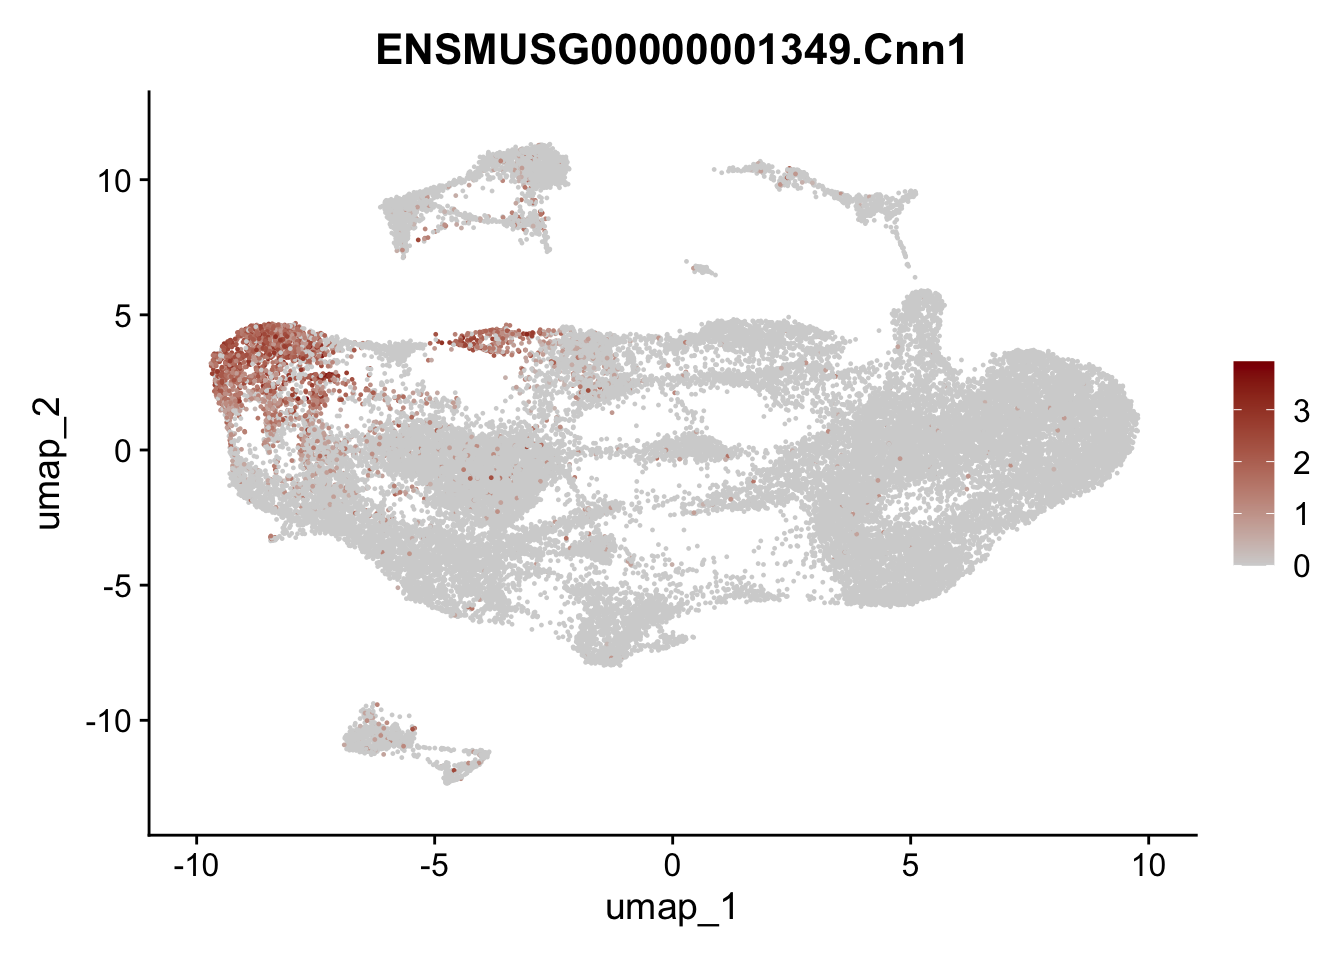
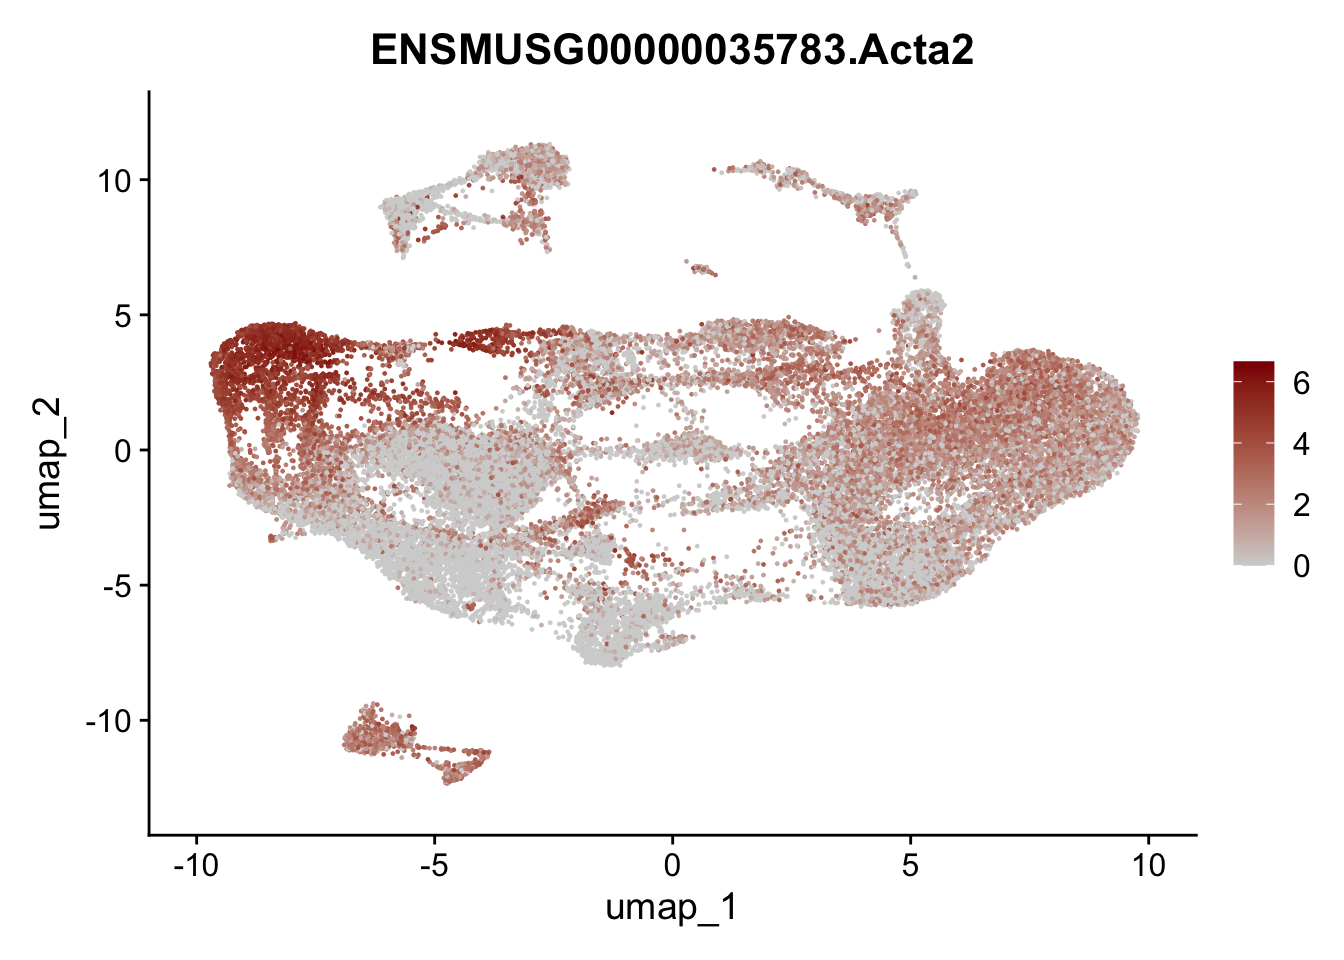
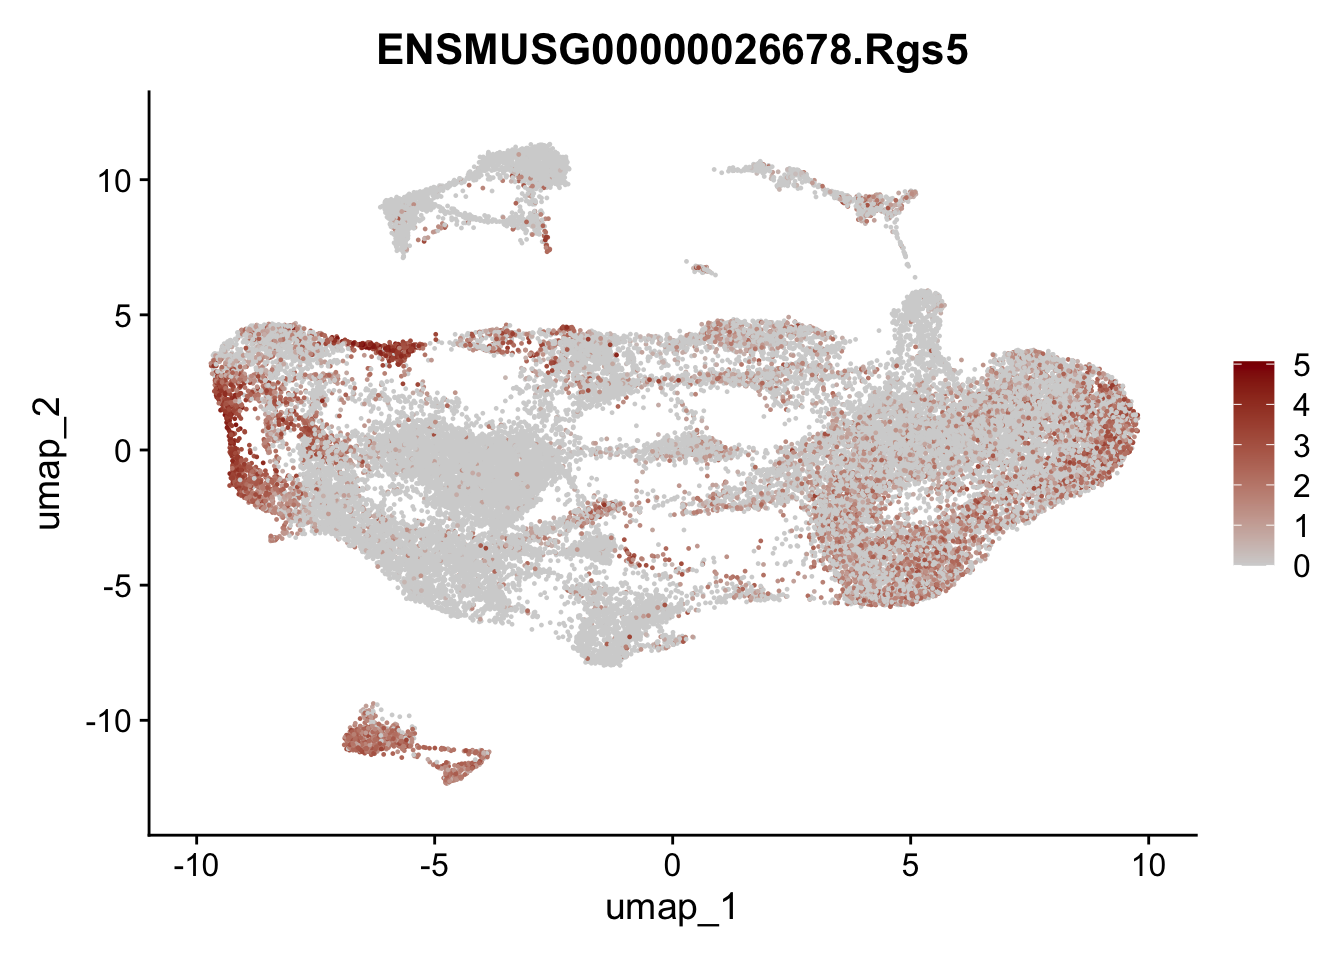
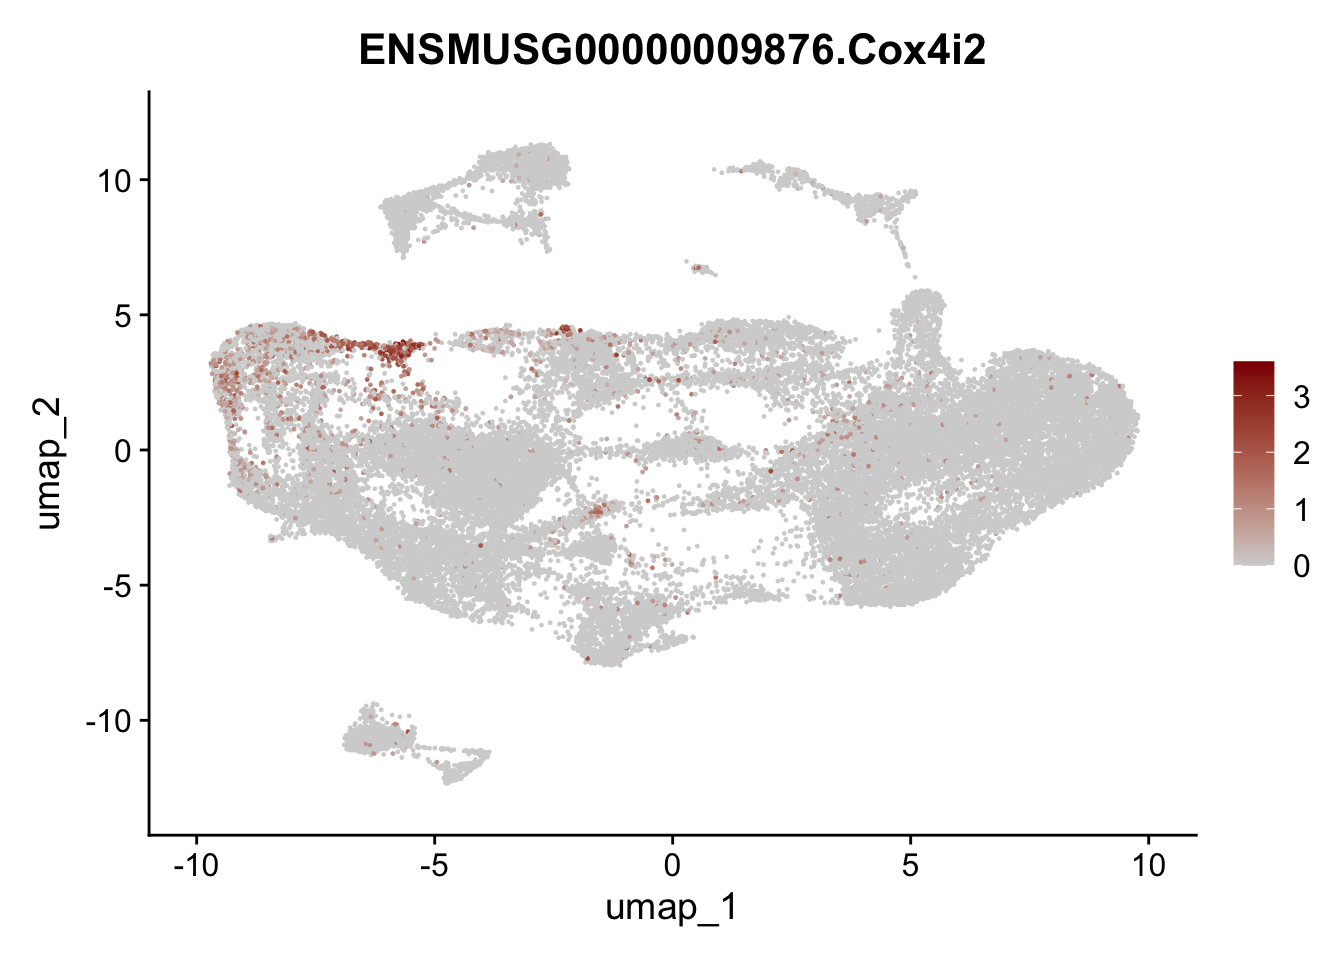
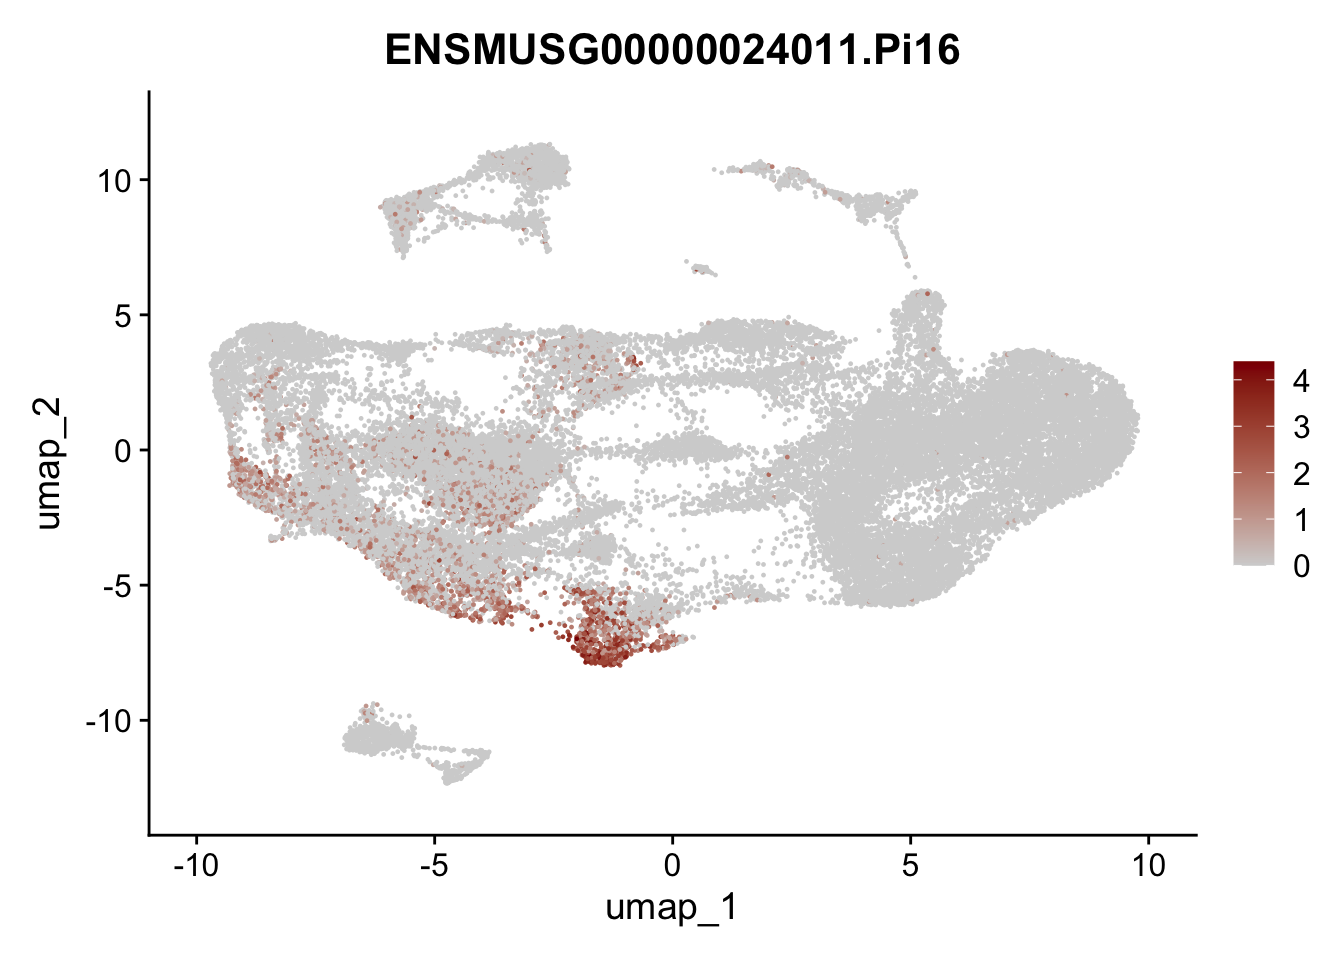
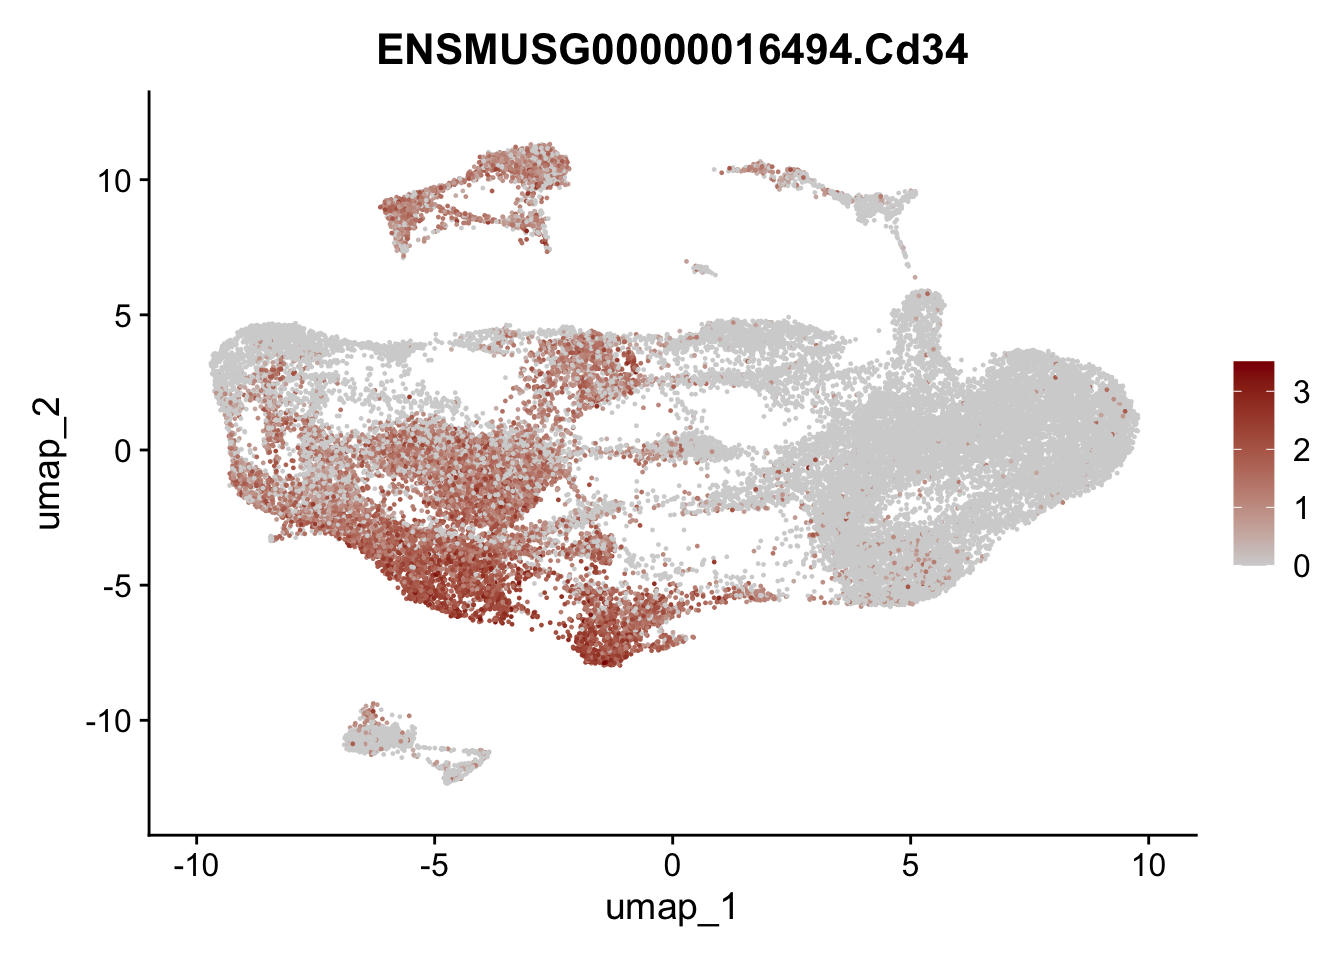
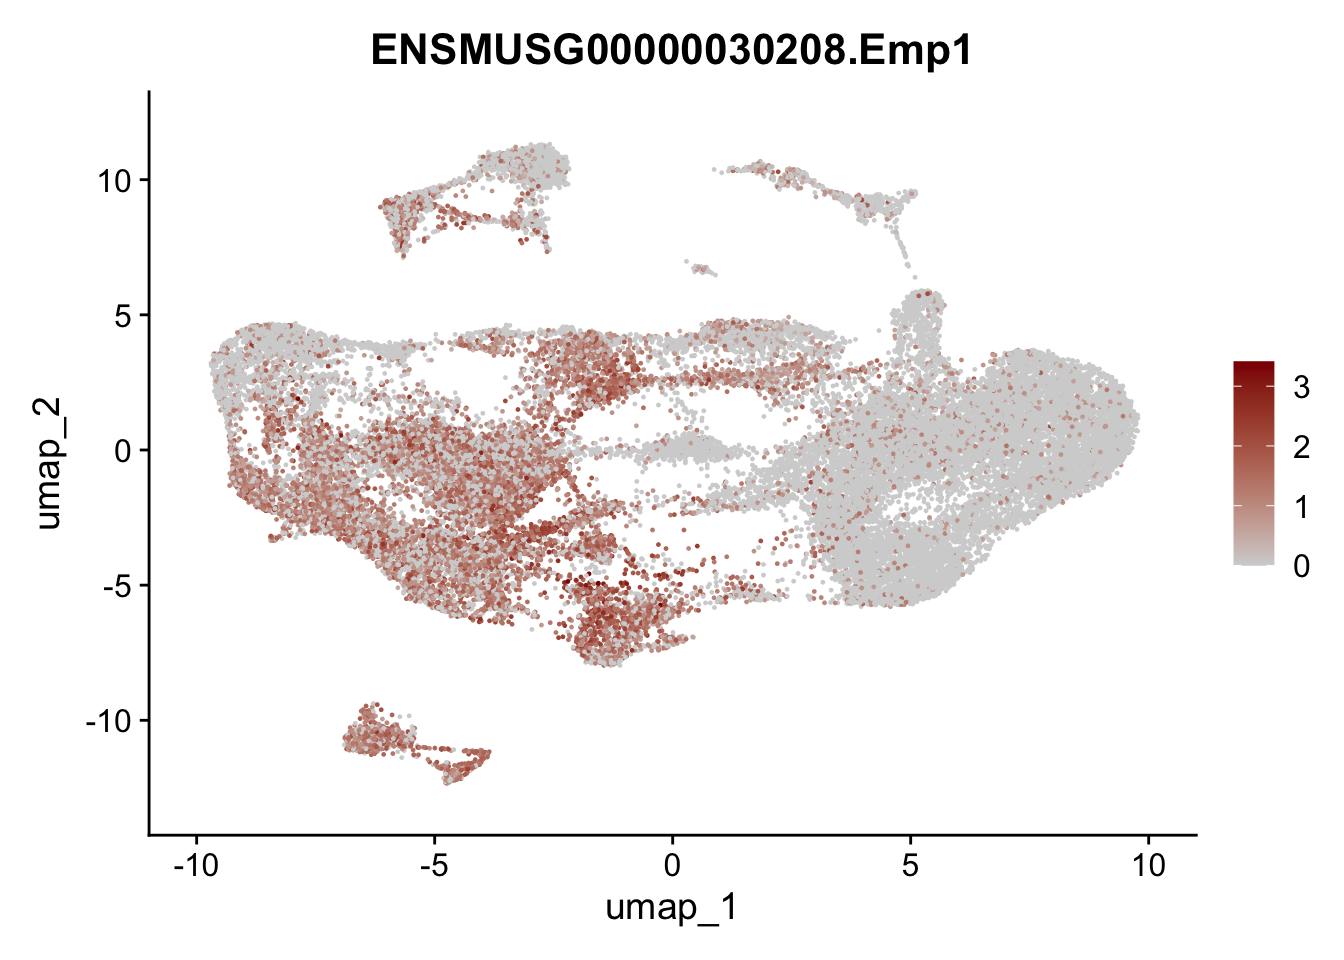
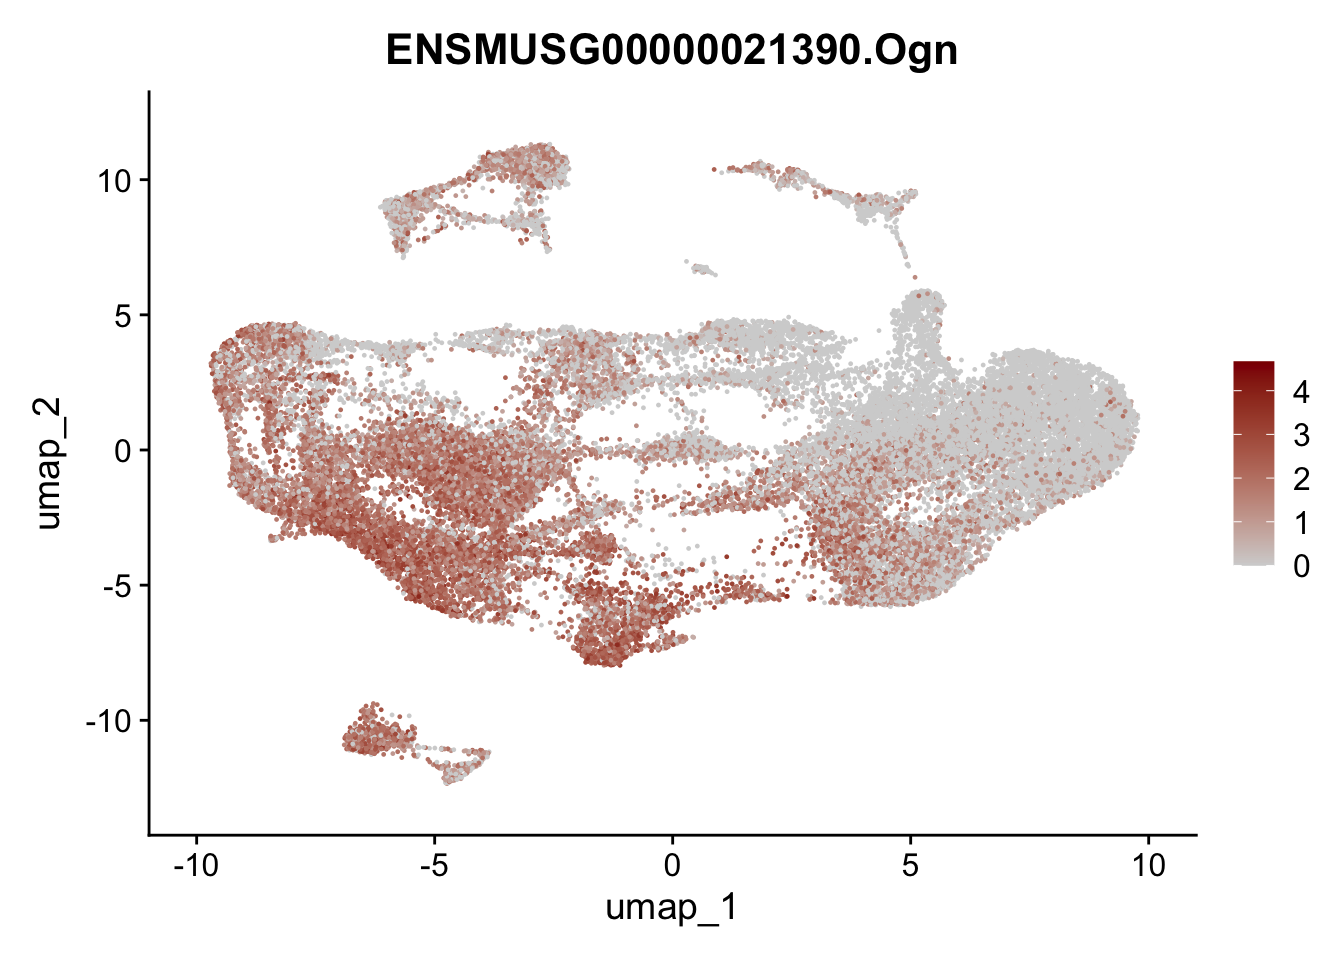
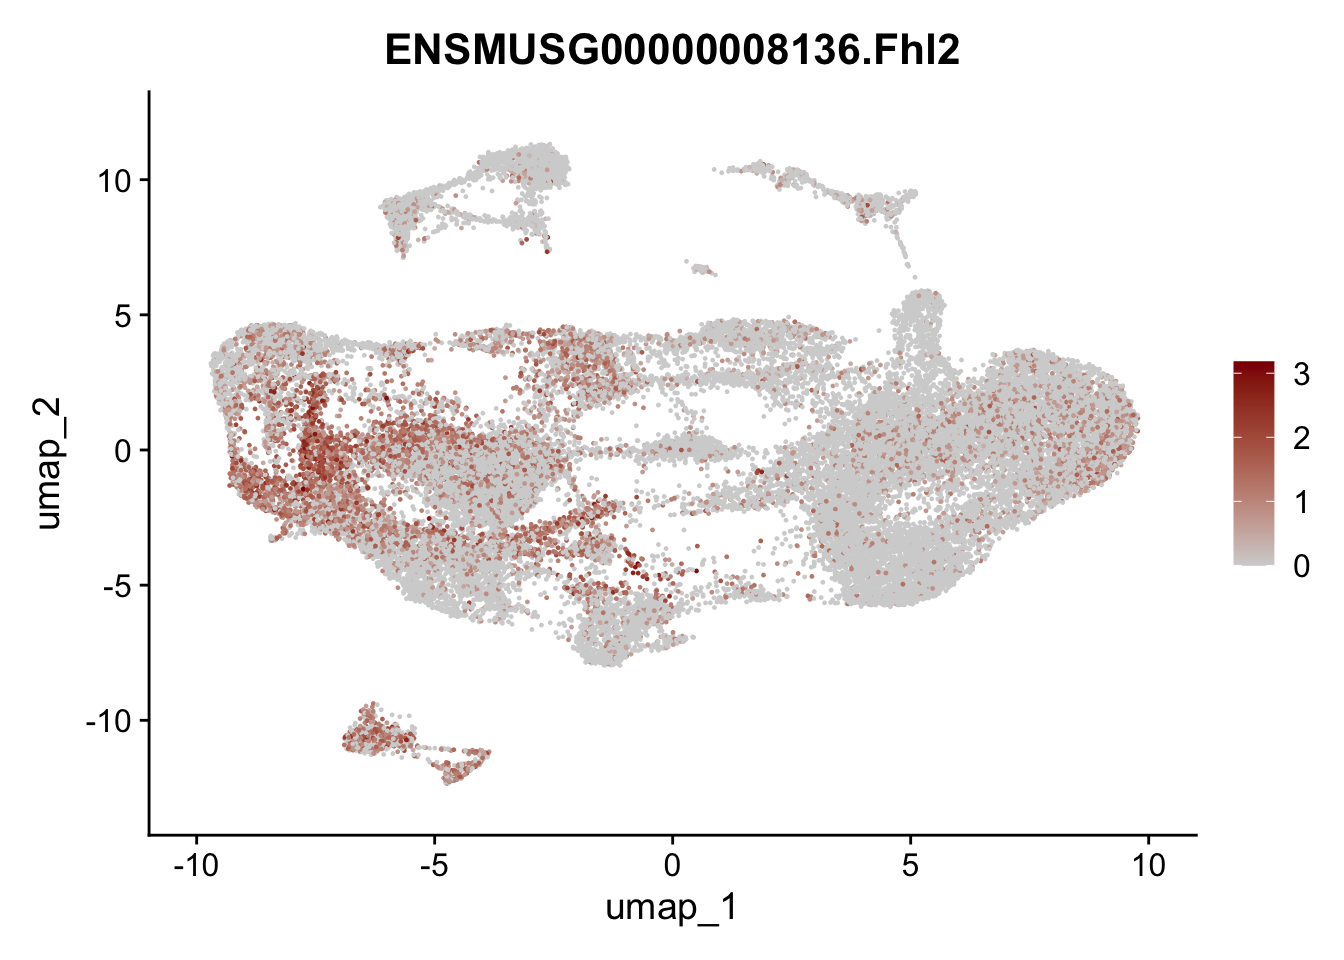
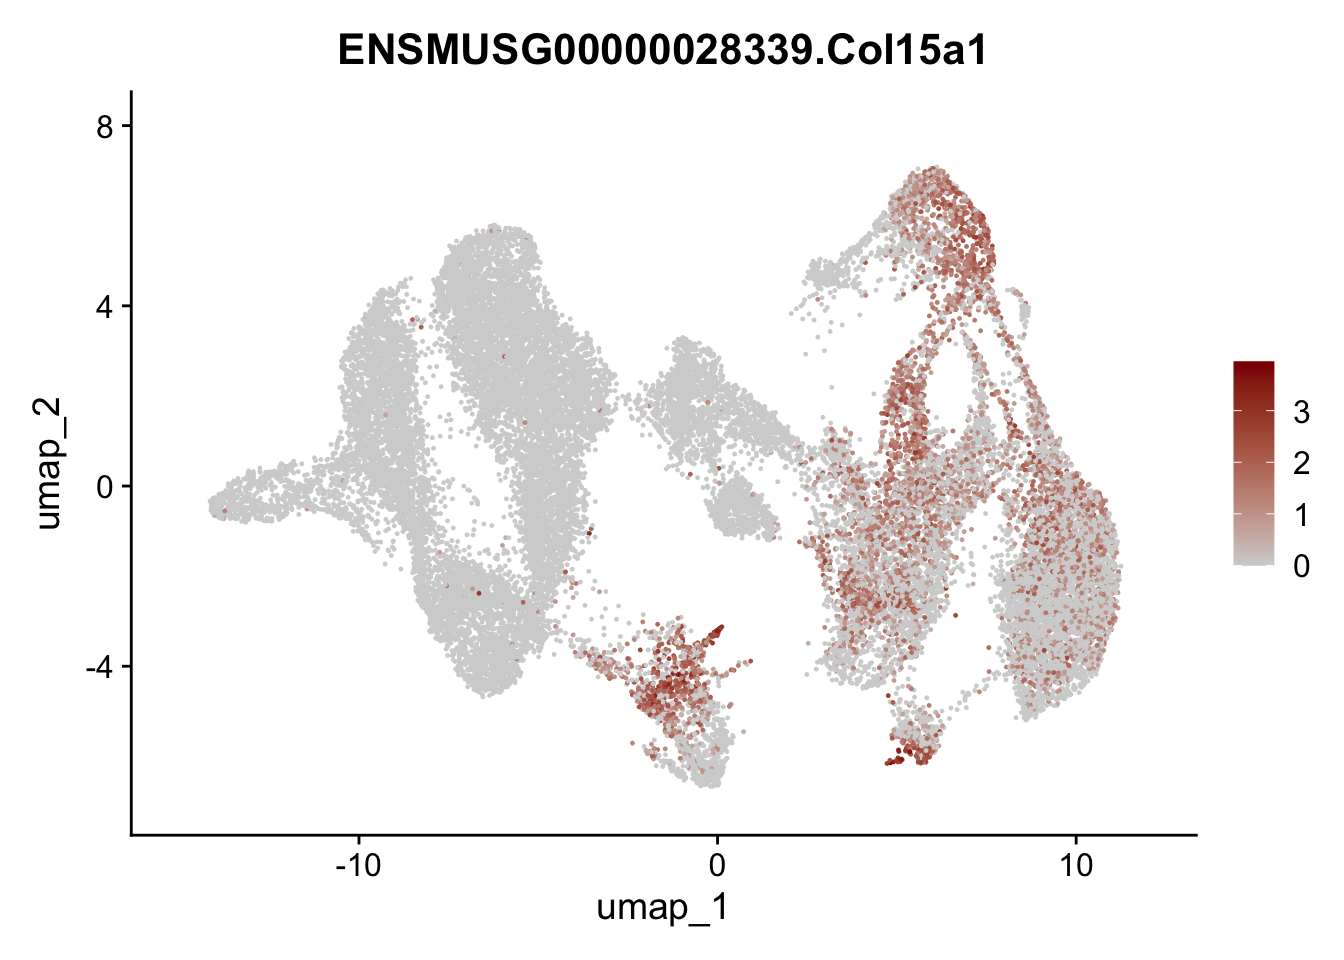
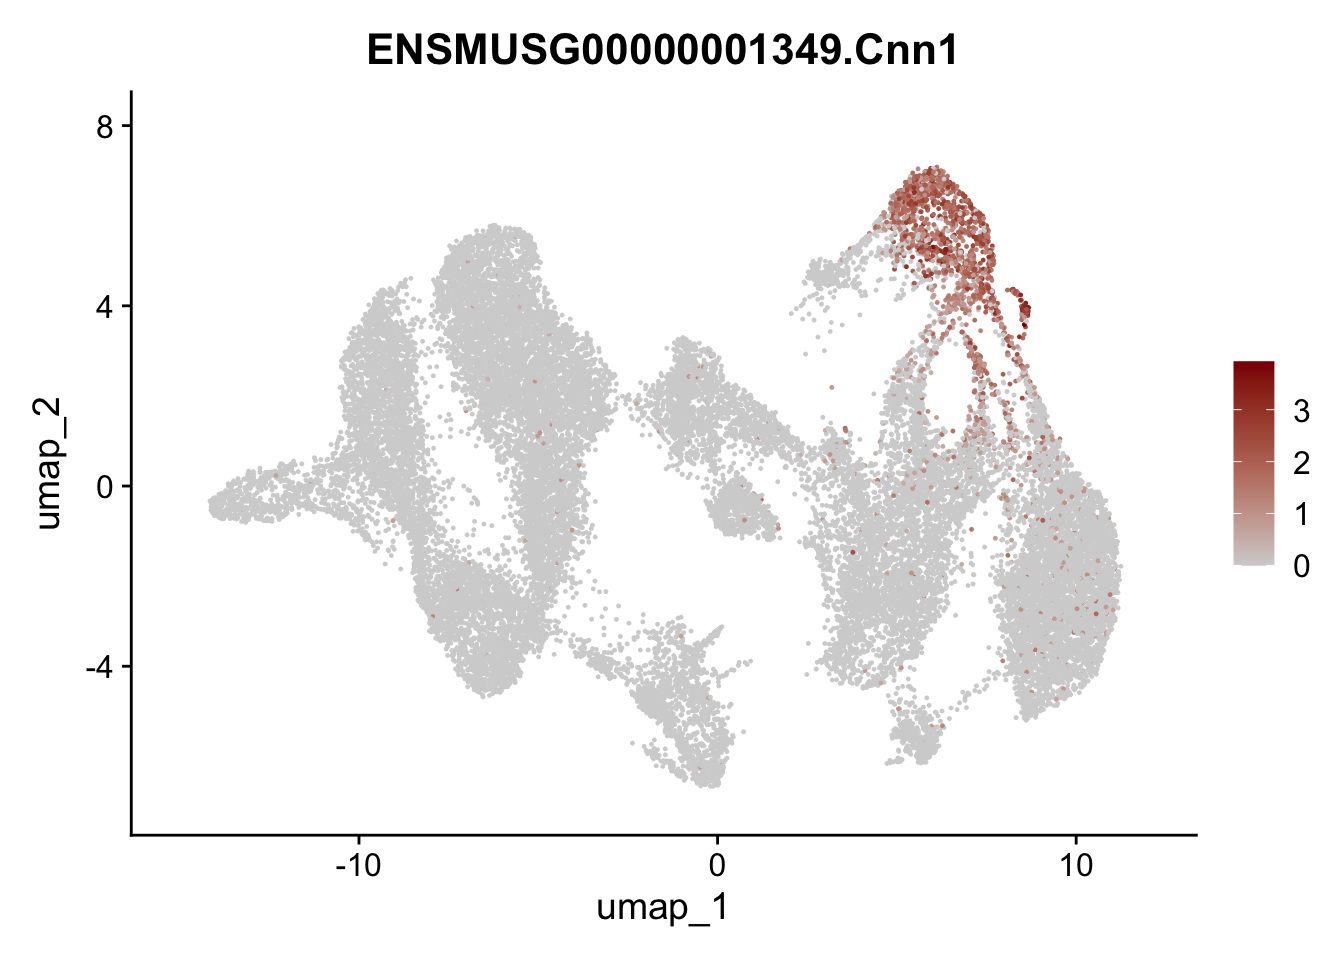
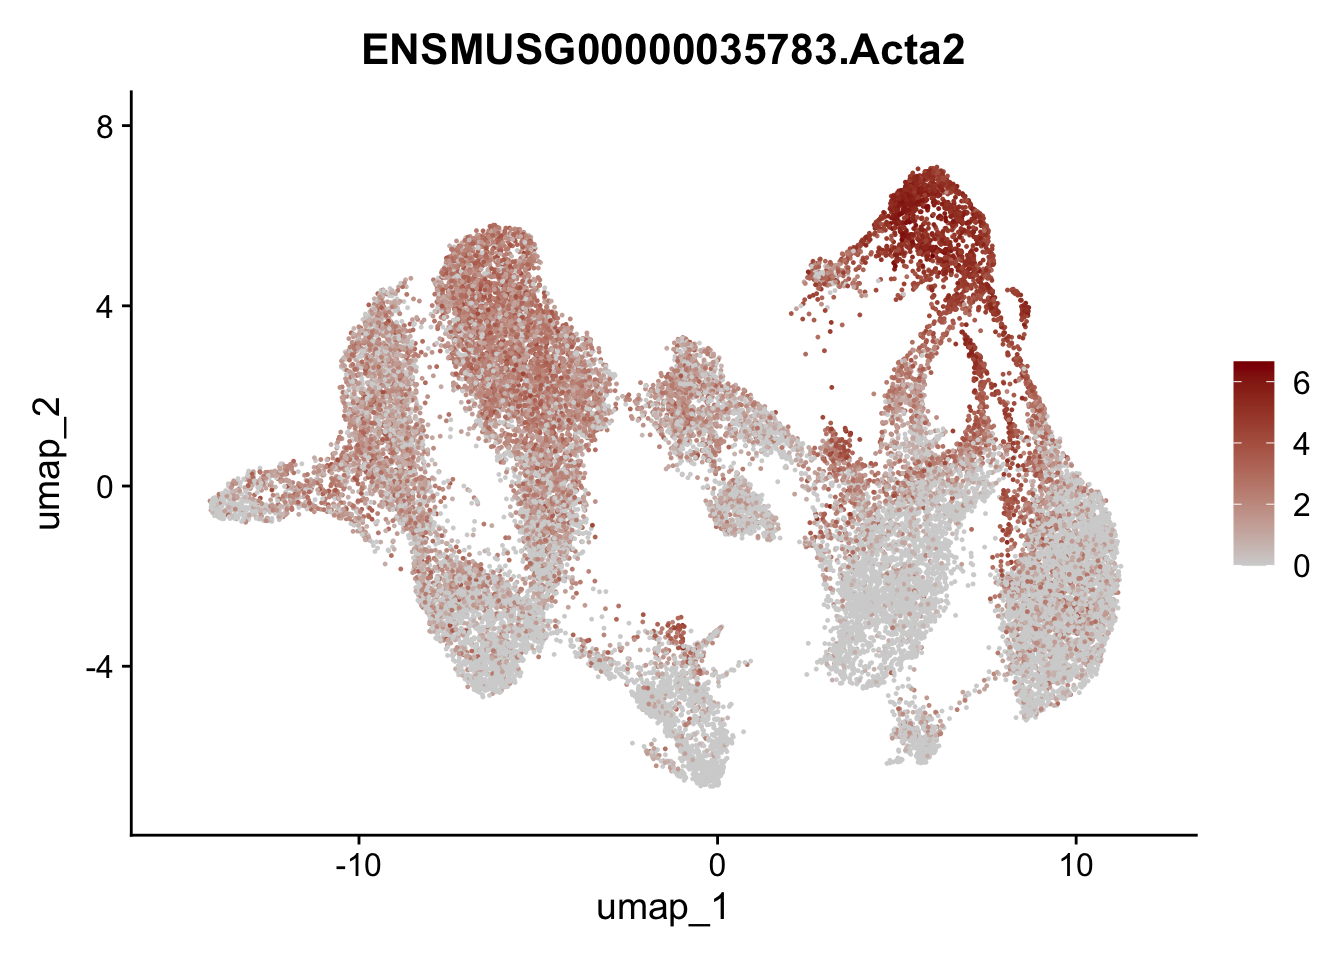
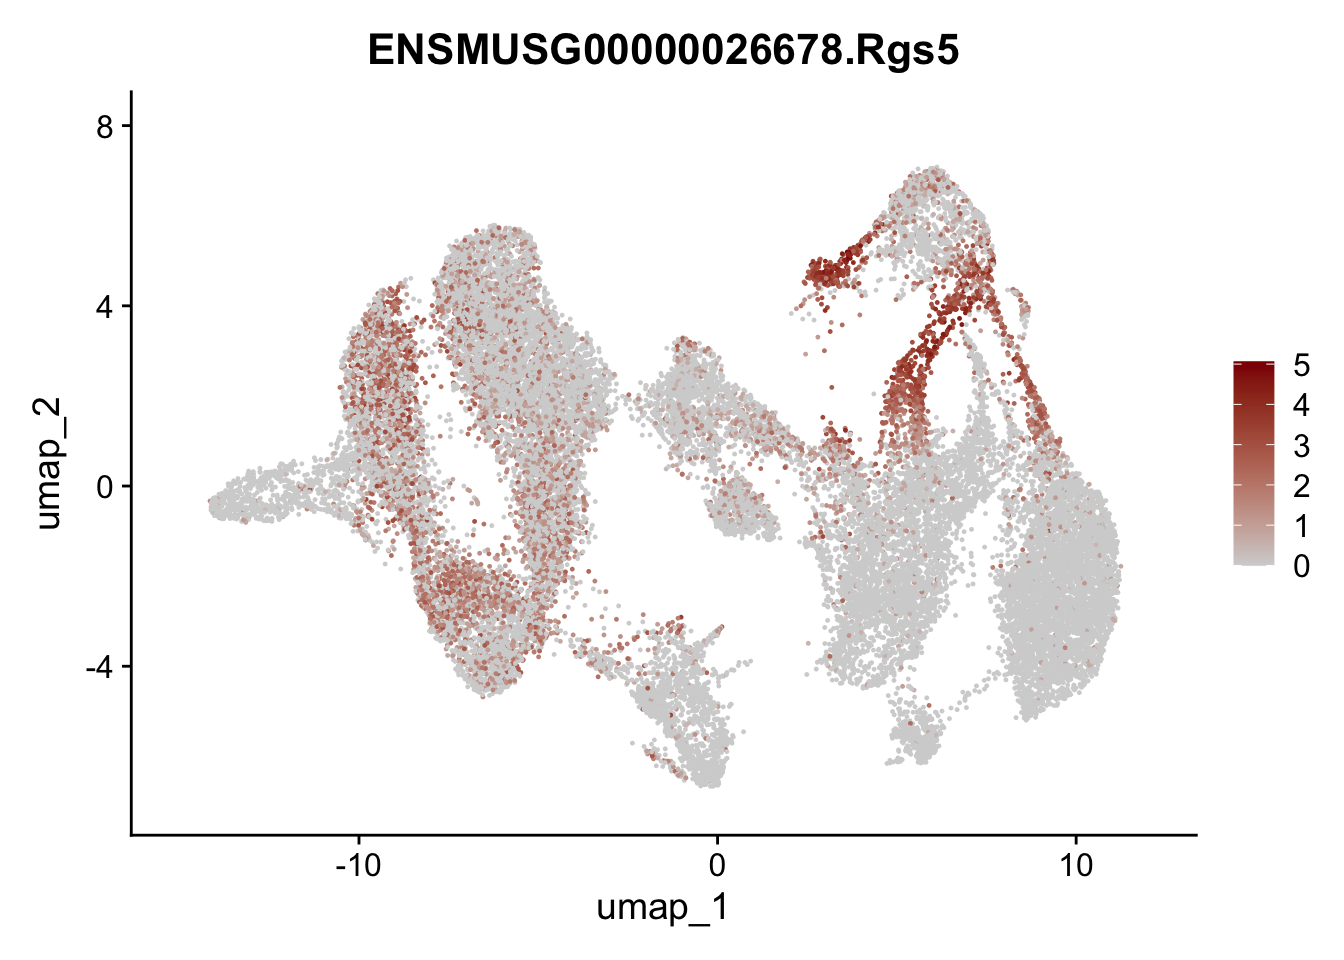
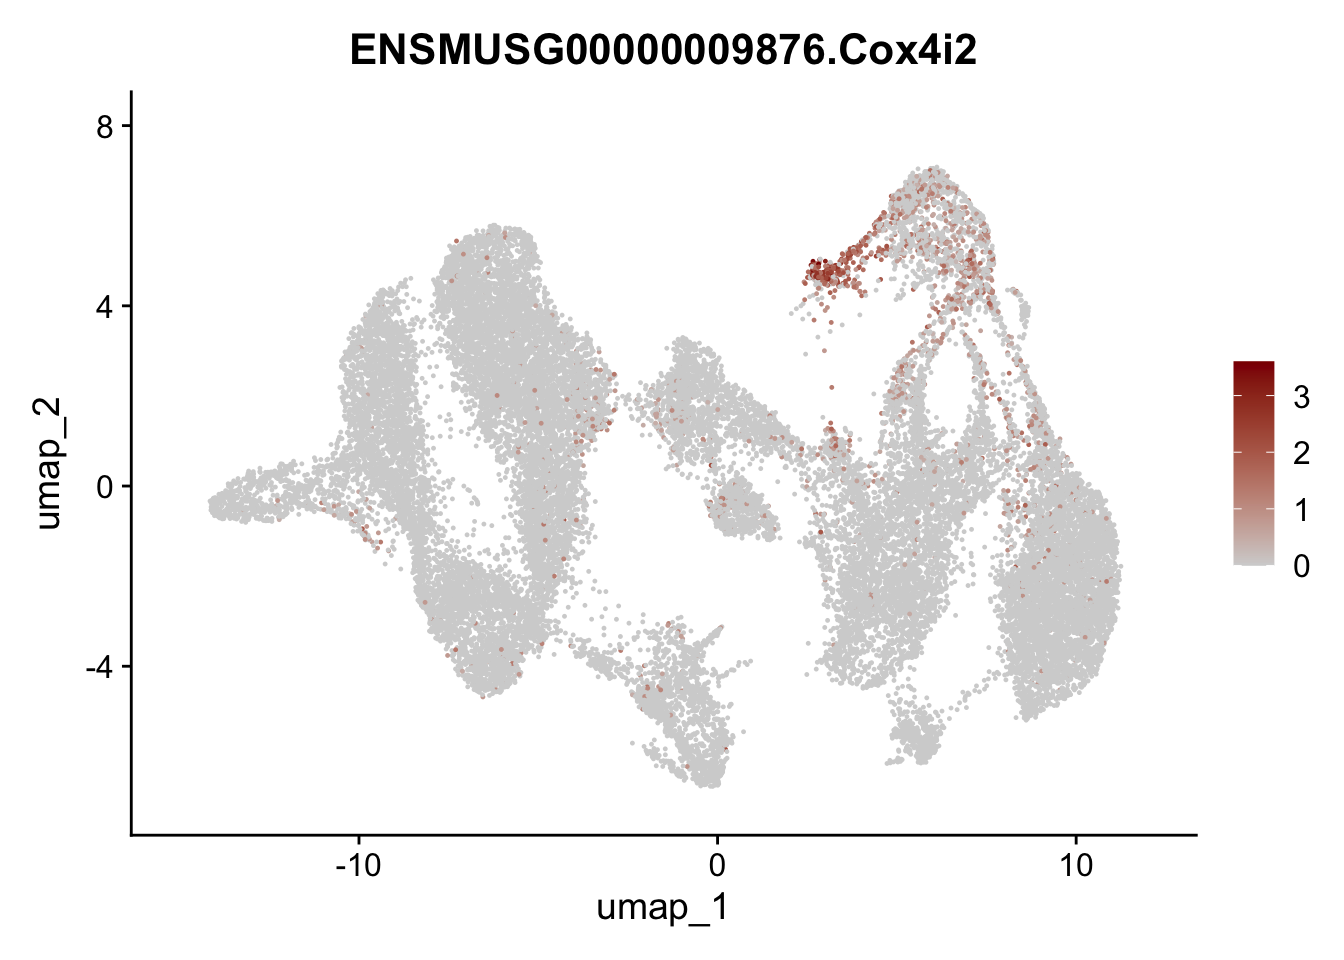
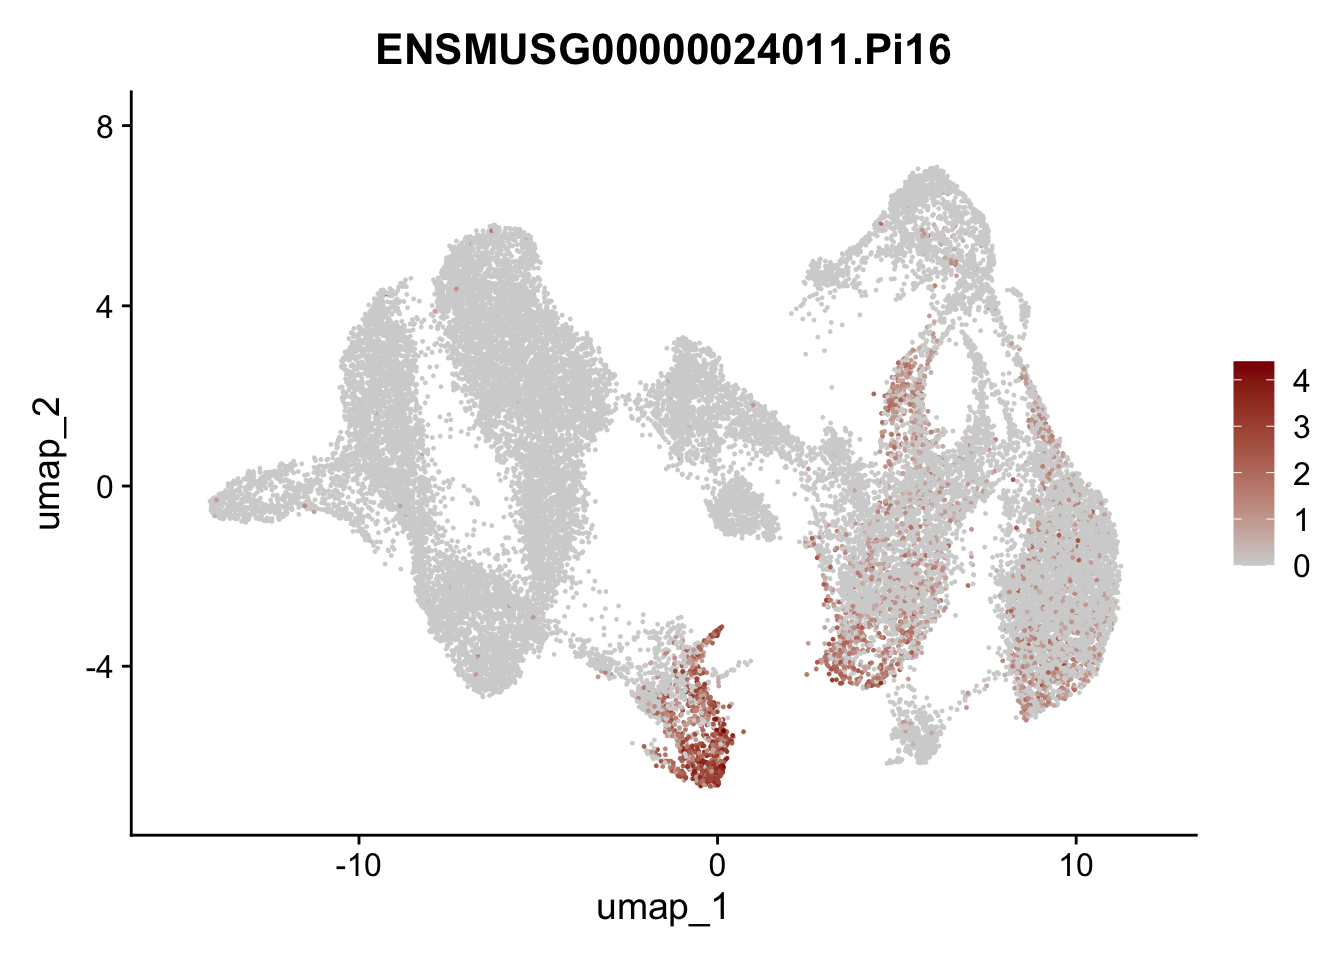
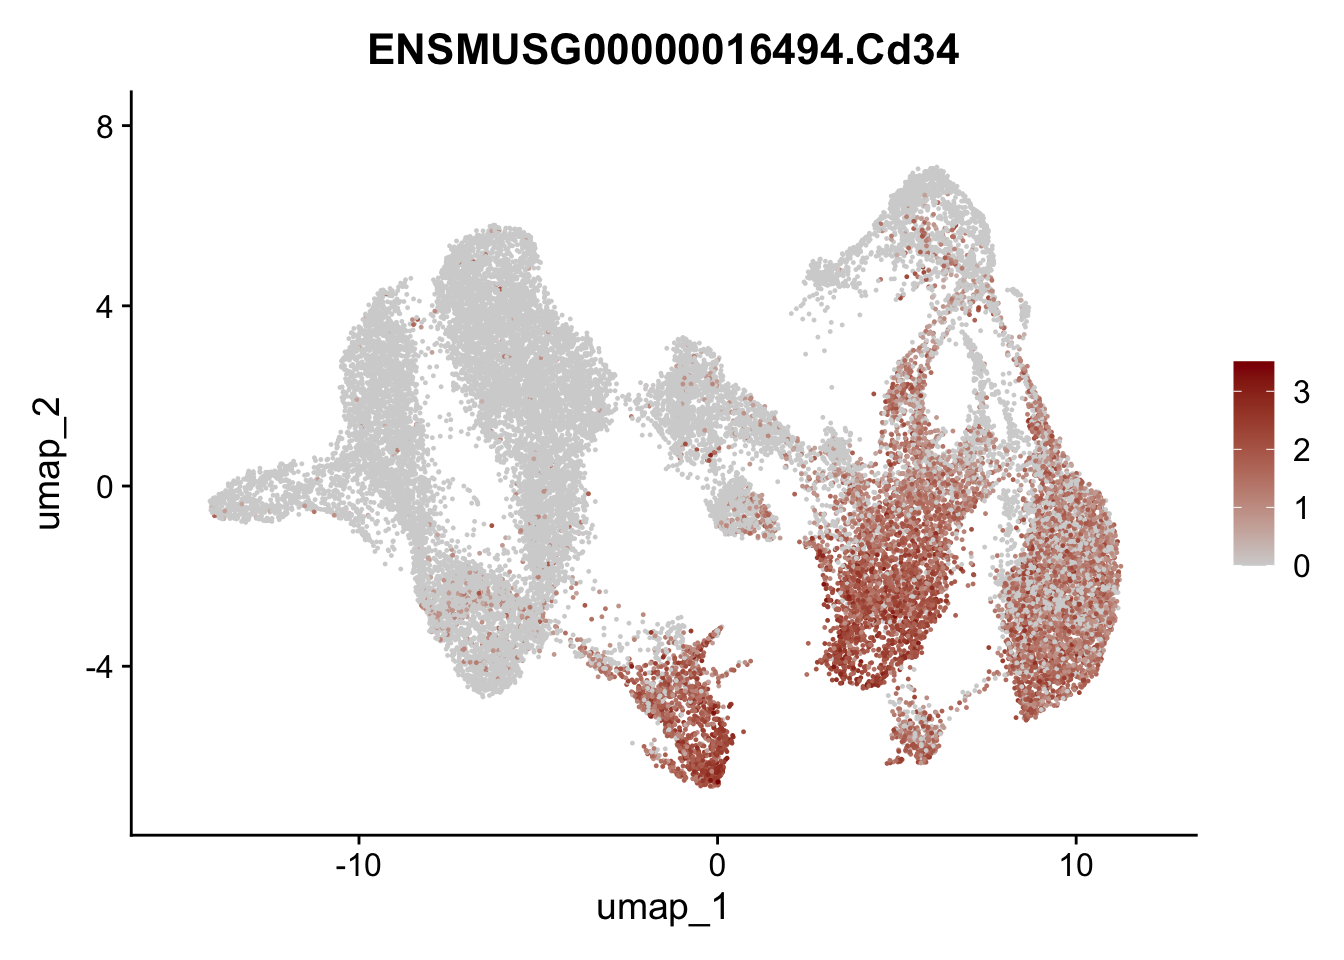
selGenesAll <- data.frame(geneID=c("Fbln1", "Col15a1", "Cnn1", "Acta2", "Rgs5",
                                   "Cox4i2", "Pi16", "Cd34", "Emp1", "Ogn",
                                   "Fhl2")) %>%
  left_join(., genes, by = "geneID")

pList <- sapply(selGenesAll$gene, function(x){
p <- FeaturePlot(seuratmLN, reduction = "umap",
            features = x,
            cols=c("lightgrey", "darkred"),
            order = F)+
  theme(legend.position="right")
  plot(p)
})
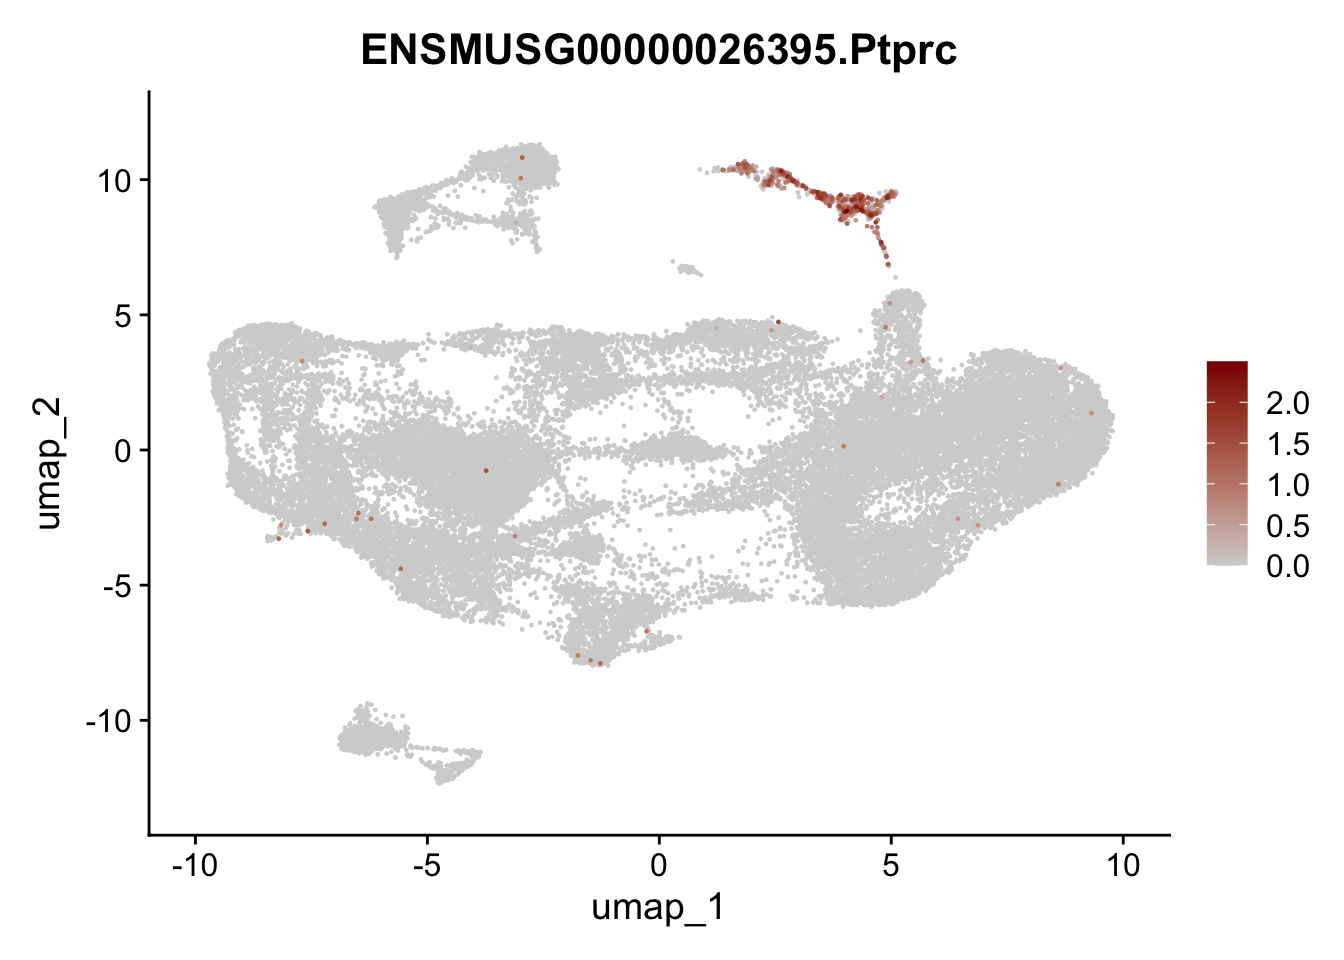
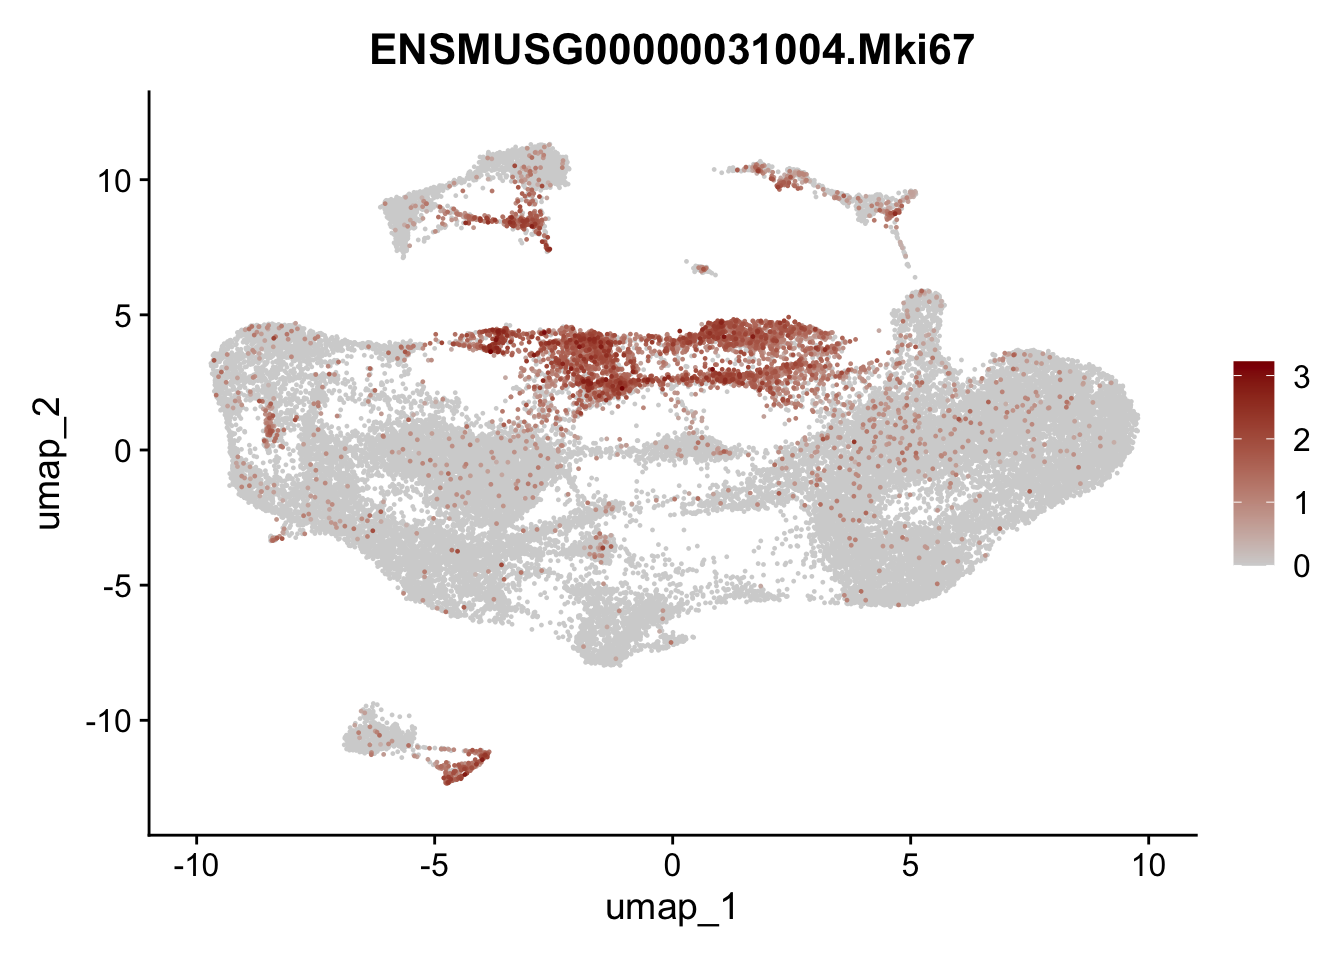
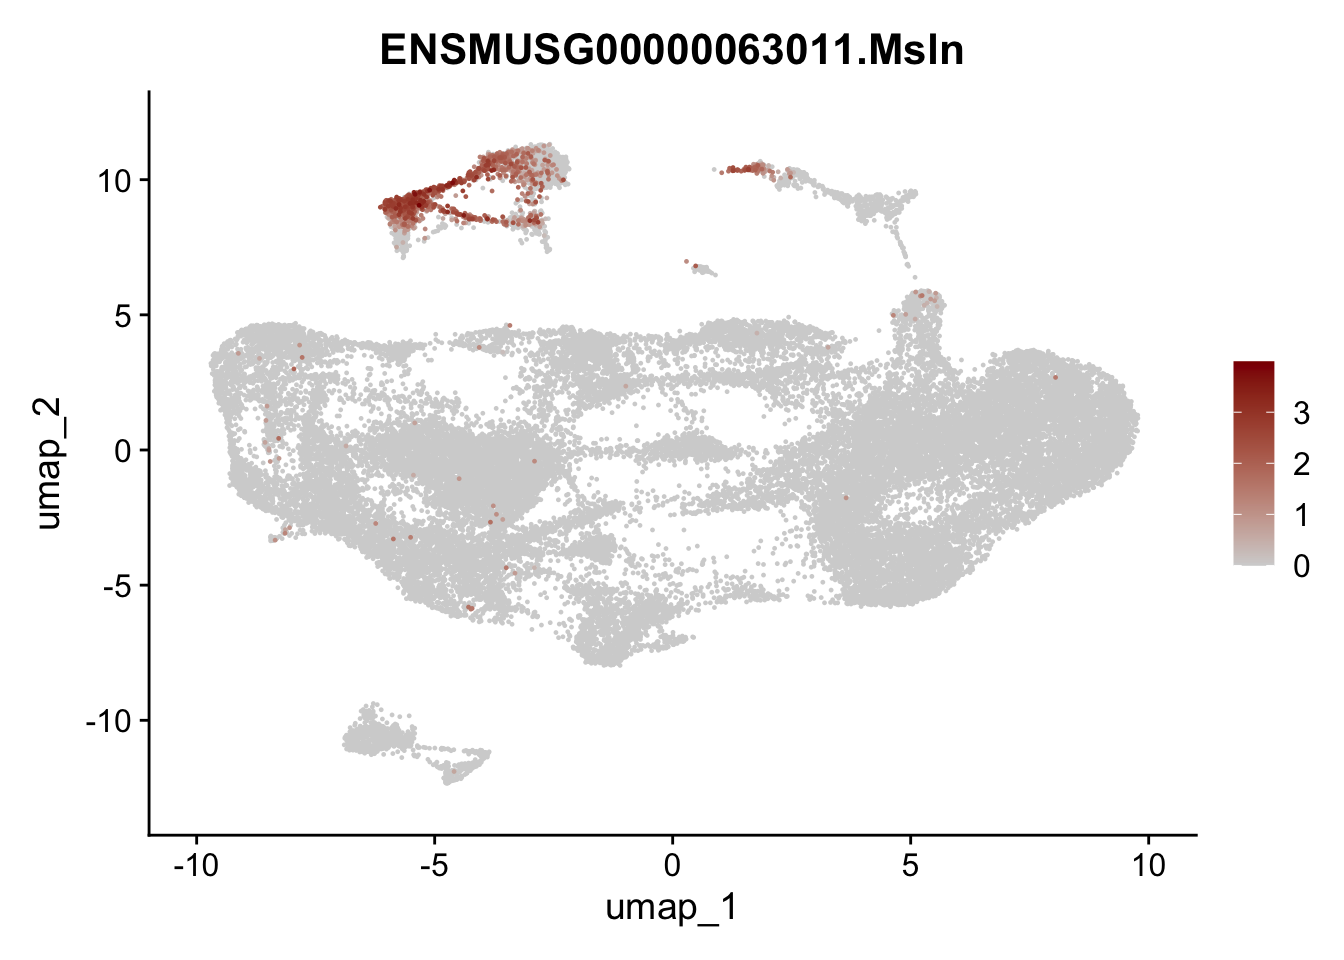
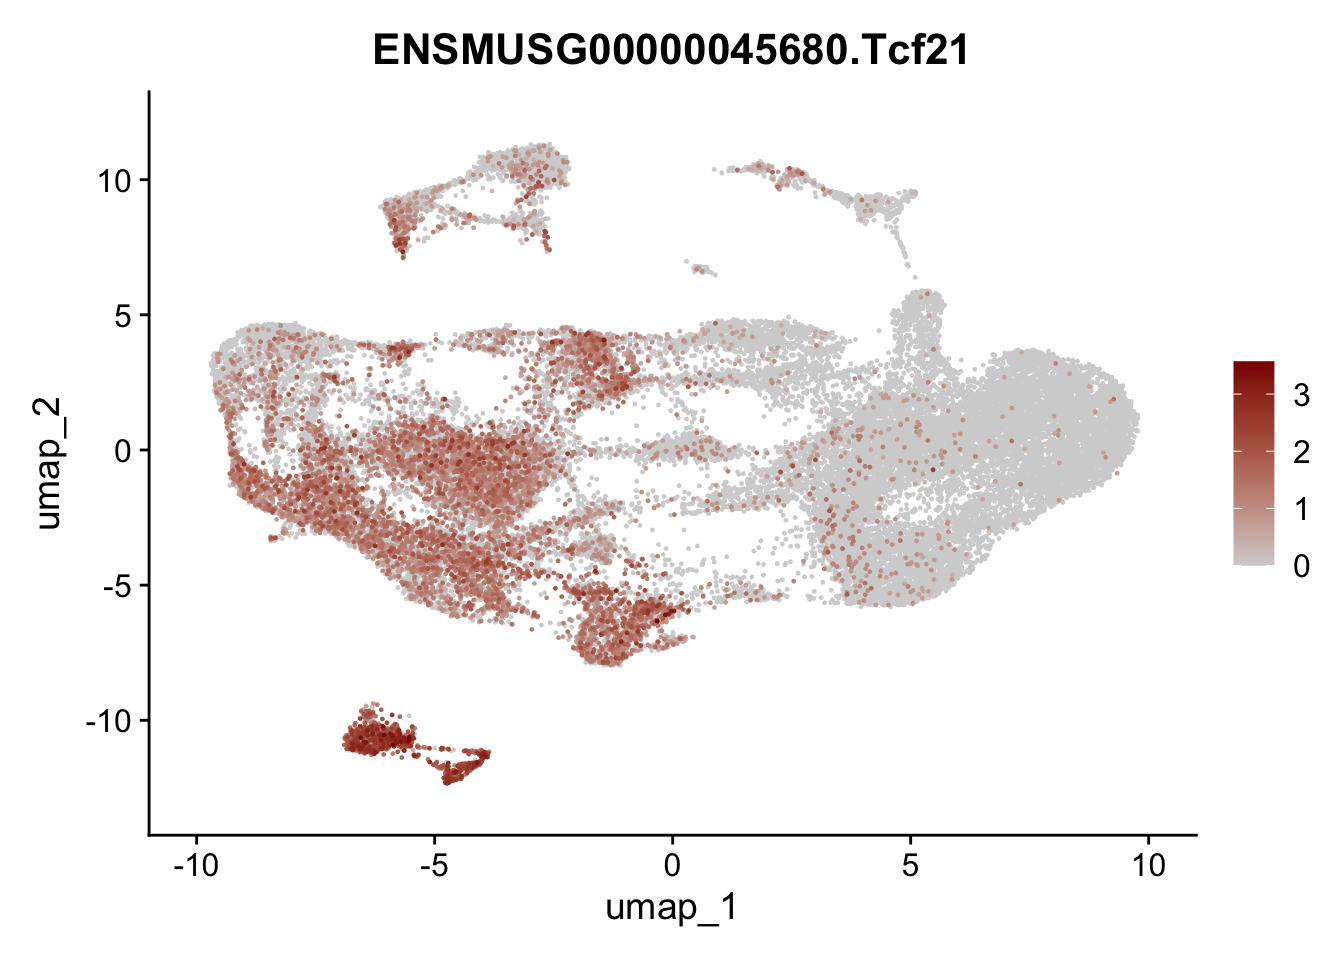
selGenesfil <- c("ENSMUSG00000026395.Ptprc", "ENSMUSG00000031004.Mki67", "ENSMUSG00000063011.Msln", "ENSMUSG00000045680.Tcf21")

pList <- sapply(selGenesfil, function(x){
  p <- FeaturePlot(seuratmLN, reduction = "umap",
            features = x,
            cols=c("lightgrey", "darkred"),
            order = T)+
  theme(legend.position="right")
  plot(p)
})
filter
## filter out Ptprc+ cells (cluster #12),
## and pancreatic cells (#15),
## and mesothelial cells (cluster#8)
## and epithelial/neuronal cells (#11)
## and proliferating cells (cluster #5 and #7)

table(seuratmLN$RNA_snn_res.0.4)
seuratF <- subset(seuratmLN, RNA_snn_res.0.4 %in% c("12", "15", "8", "11", "5", "7"), invert = TRUE)
table(seuratF$RNA_snn_res.0.4)

seuratmLNf3 <- seuratF
remove(seuratF)
table(seuratmLNf3$orig.ident)
rerun
## rerun seurat
seuratmLNf3 <- NormalizeData (object = seuratmLNf3)
seuratmLNf3 <- FindVariableFeatures(object = seuratmLNf3)
seuratmLNf3 <- ScaleData(object = seuratmLNf3, verbose = TRUE)
seuratmLNf3 <- RunPCA(object=seuratmLNf3, npcs = 30, verbose = FALSE)
seuratmLNf3 <- RunTSNE(object=seuratmLNf3, reduction="pca", dims = 1:20)
seuratmLNf3 <- RunUMAP(object=seuratmLNf3, reduction="pca", dims = 1:20)
seuratmLNf3 <- FindNeighbors(object = seuratmLNf3, reduction = "pca", dims= 1:20)

res <- c(0.25, 0.6, 0.8, 0.4)
for (i in 1:length(res)) {
  seuratmLNf3 <- FindClusters(object = seuratmLNf3, resolution = res[i], random.seed = 1234)
}
load object mLN EYFP+ fil
fileNam <- paste0(basedir, "/data/LNmLToRev_EYFP_mLNf3_seurat.rds")
seuratmLNf3 <- readRDS(fileNam)
table(seuratmLNf3$dataset)
    380131_04-4_20250224_Cxcl13EYFP_P7_mLN_YFPpos     380131_05-5_20250224_Cxcl13EYFP_P7_mLN_YFPneg
                                             3922                                                12
   380131_07-7_20250225_Cxcl13EYFP_E18_mLN_YFPpos    380131_08-8_20250225_Cxcl13EYFP_E18_mLN_YFPneg
                                             2392                                                 5
380131_12-12_20250305_Mu_Cxcl13EYFP_Adult_mLN_FRC 382581_02-2_20250311_Mu_Cxcl13EYFP_E18_mLN_YFPpos
                                             3798                                              3617
382581_03-3_20250311_Mu_Cxcl13EYFP_E18_mLN_YFPneg  382581_06-6_20250319_Mu_Cxcl13EYFP_P7_mLN_YFPpos
                                               15                                              4274
 382581_07-7_20250319_Mu_Cxcl13EYFP_P7_mLN_YFPneg  382581_09-9_20250320_Mu_Cxcl13EYFP_Adult_mLN_FRC
                                               11                                              2711
 382581_14-14_20250402_Mu_Cxcl13EYFP_3wk_mLN_fib1  382581_15-15_20250402_Mu_Cxcl13EYFP_3wk_mLN_fib2
                                             3223                                              4289
dimplot
clustering
colPal <- c("#DAF7A6", "#FFC300", "#FF5733", "#C70039", "#900C3F", "#b66e8d",
            "#61a4ba", "#6178ba", "#54a87f",  "#25328a",
            "#b6856e", "#0073C2FF", "#EFC000FF", "#868686FF", "#CD534CFF",
            "#7AA6DCFF", "#003C67FF", "#8F7700FF", "#3B3B3BFF", "#A73030FF",
            "#4A6990FF")[1:length(unique(seuratmLNf3$RNA_snn_res.0.4))]
names(colPal) <- unique(seuratmLNf3$RNA_snn_res.0.4)

DimPlot(seuratmLNf3, reduction = "umap", group.by = "RNA_snn_res.0.4",
        cols = colPal, label = TRUE)+
  theme_bw() +
  theme(axis.text = element_blank(), axis.ticks = element_blank(),
        panel.grid.minor = element_blank()) +
  xlab("UMAP1") +
  ylab("UMAP2")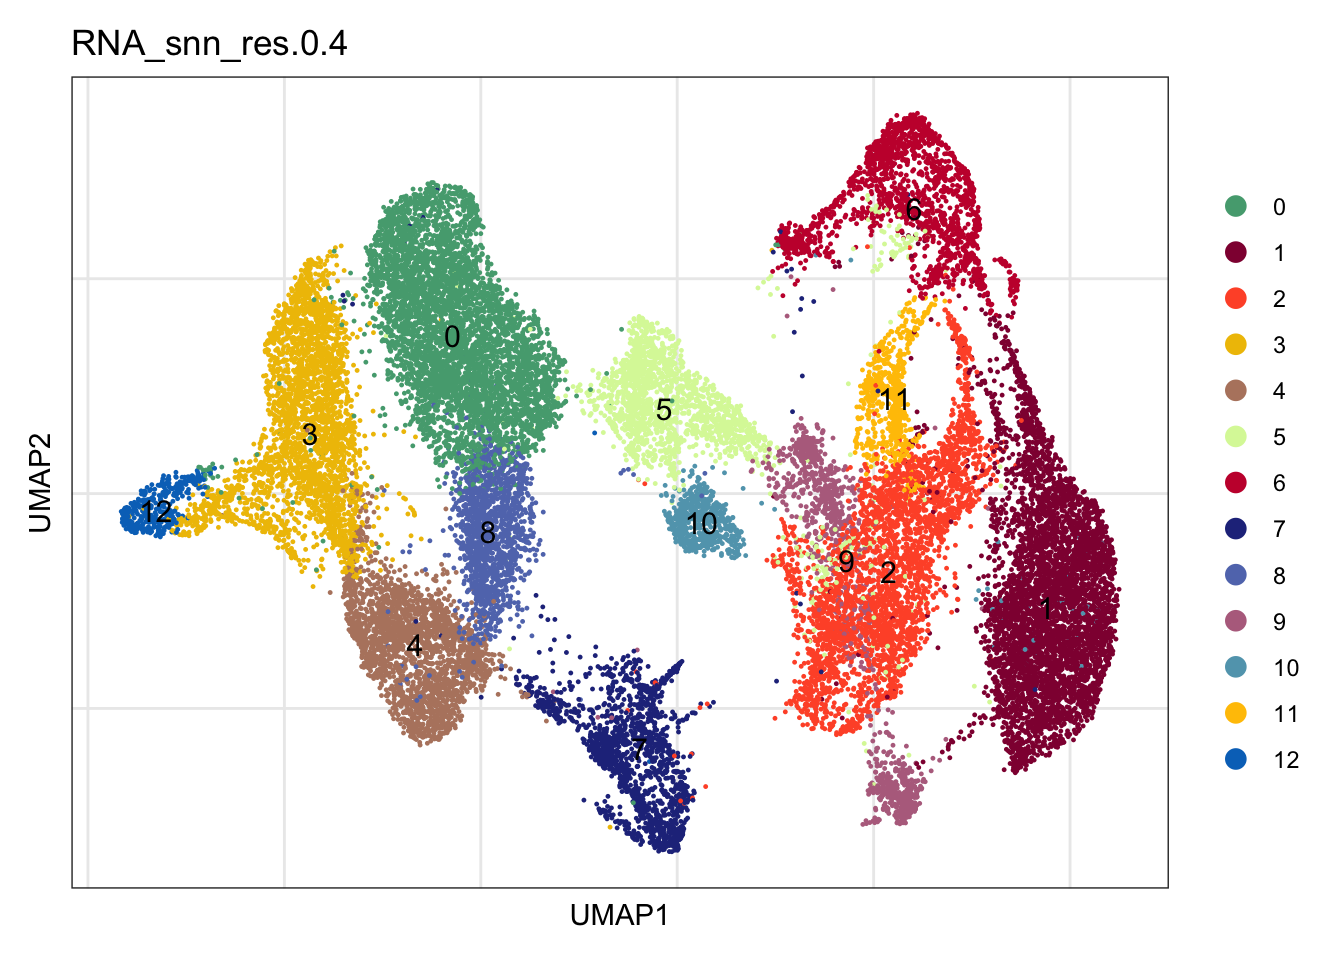
timepoint
DimPlot(seuratmLNf3, reduction = "umap", group.by = "timepoint",
        cols = coltimepoint)+
  theme_bw() +
  theme(axis.text = element_blank(), axis.ticks = element_blank(),
        panel.grid.minor = element_blank()) +
  xlab("UMAP1") +
  ylab("UMAP2")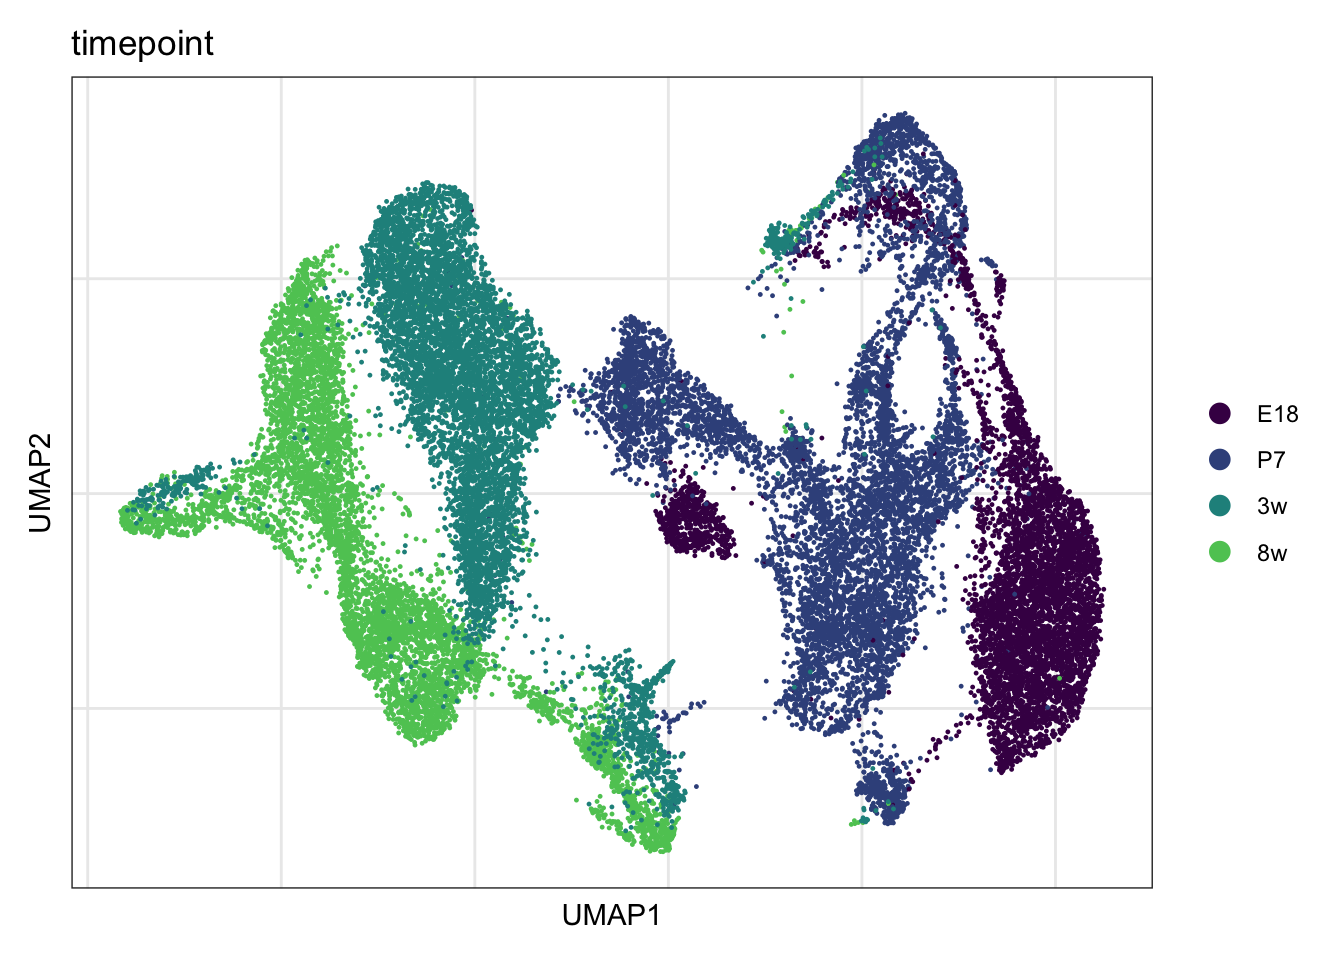
label transfer
fileNam <- paste0(basedir, "/data/LNmLToRev_adultonly_seurat.integrated.rds")
seuratLab <- readRDS(fileNam)

seuratLab <- subset(seuratLab, location=="mLN")
seuratLab <- subset(seuratLab, EYFP=="pos")
table(seuratLab$label)
  actMedRC    FDC/MRC      MedRC MedRC/IFRC    Pi16+RC        PRC       TBRC        TRC       VSMC
      1047        692        275       1259        262        673       1291        913         47
dimplot label
labCells <- data.frame(label=seuratLab$label) %>% rownames_to_column(., "cell")
allCell <- data.frame(cell=colnames(seuratmLNf3)) %>%
  left_join(., labCells, by= "cell")
allCell$label[which(is.na(allCell$label))] <- "unassigned"
seuratmLNf3$label <- allCell$label

table(seuratmLNf3$timepoint)
 E18   P7   3w   8w
6029 8219 7512 6509
table(seuratmLNf3$label)
  actMedRC    FDC/MRC      MedRC MedRC/IFRC    Pi16+RC        PRC       TBRC        TRC unassigned
      1047        689        274       1259        262        673       1291        913      21814
      VSMC
        47
colLab <- c("#42a071", "#900C3F","#b66e8d", "#61a4ba", "#424671", "#003C67FF",
"#e3953d", "#714542", "#b6856e", "#a4a4a4")
names(colLab) <- c("FDC/MRC", "TRC", "TBRC", "MedRC/IFRC", "MedRC" , "actMedRC",
"PRC", "Pi16+RC", "VSMC", "unassigned")
DimPlot(seuratmLNf3, reduction = "umap", group.by = "label",
cols = colLab, shuffle=T)+
theme_bw() +
theme(axis.text = element_blank(), axis.ticks = element_blank(),
panel.grid.minor = element_blank()) +
xlab("UMAP1") +
ylab("UMAP2")![]()
DimPlot(seuratmLNf3, reduction = "umap", group.by = "label", pt.size=0.5,
        cols = colLab, order = TRUE)+
theme_void()![]()
DimPlot(seuratmLNf3, reduction = "umap", group.by = "label", pt.size=0.5,
        cols = colLab, shuffle = FALSE)+
theme_void()![]()
calculate cluster marker genes mLNf3
##cluster marker
Idents(seuratmLNf3) <- seuratmLNf3$RNA_snn_res.0.4
markerGenes <- FindAllMarkers(seuratmLNf3, only.pos=T) %>%
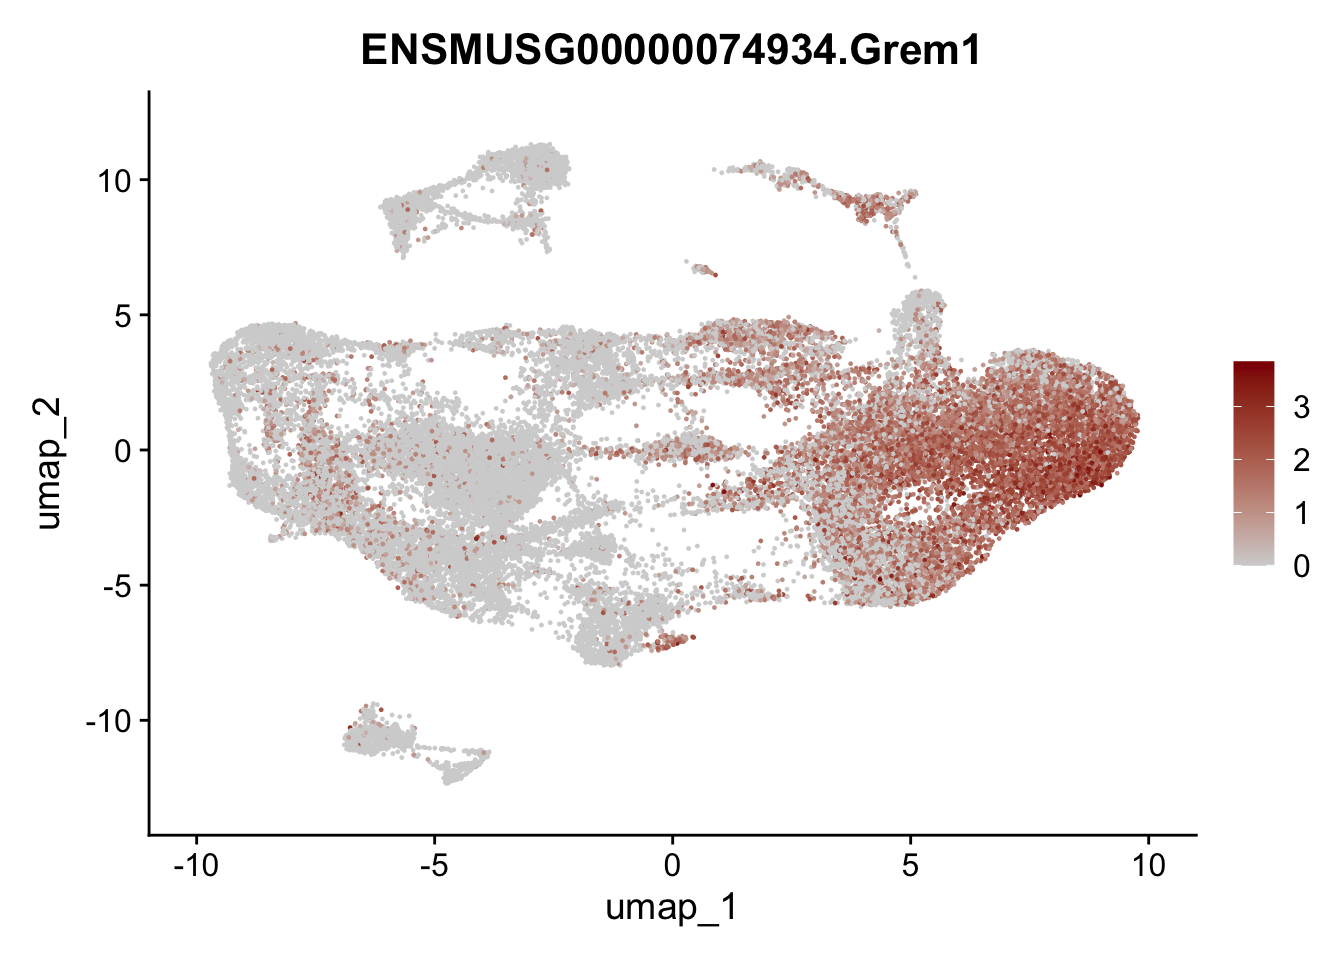
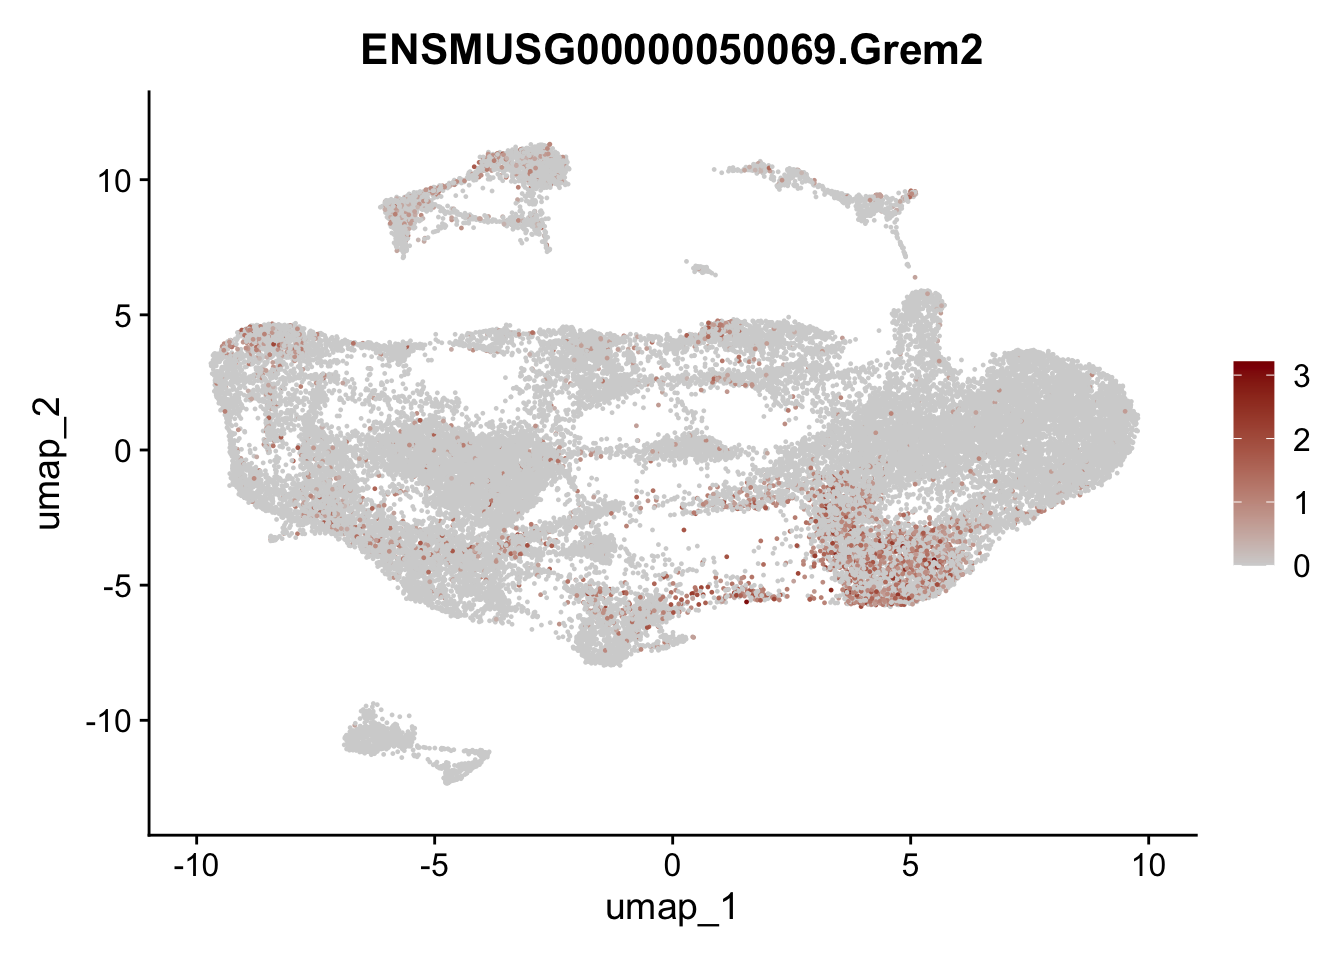
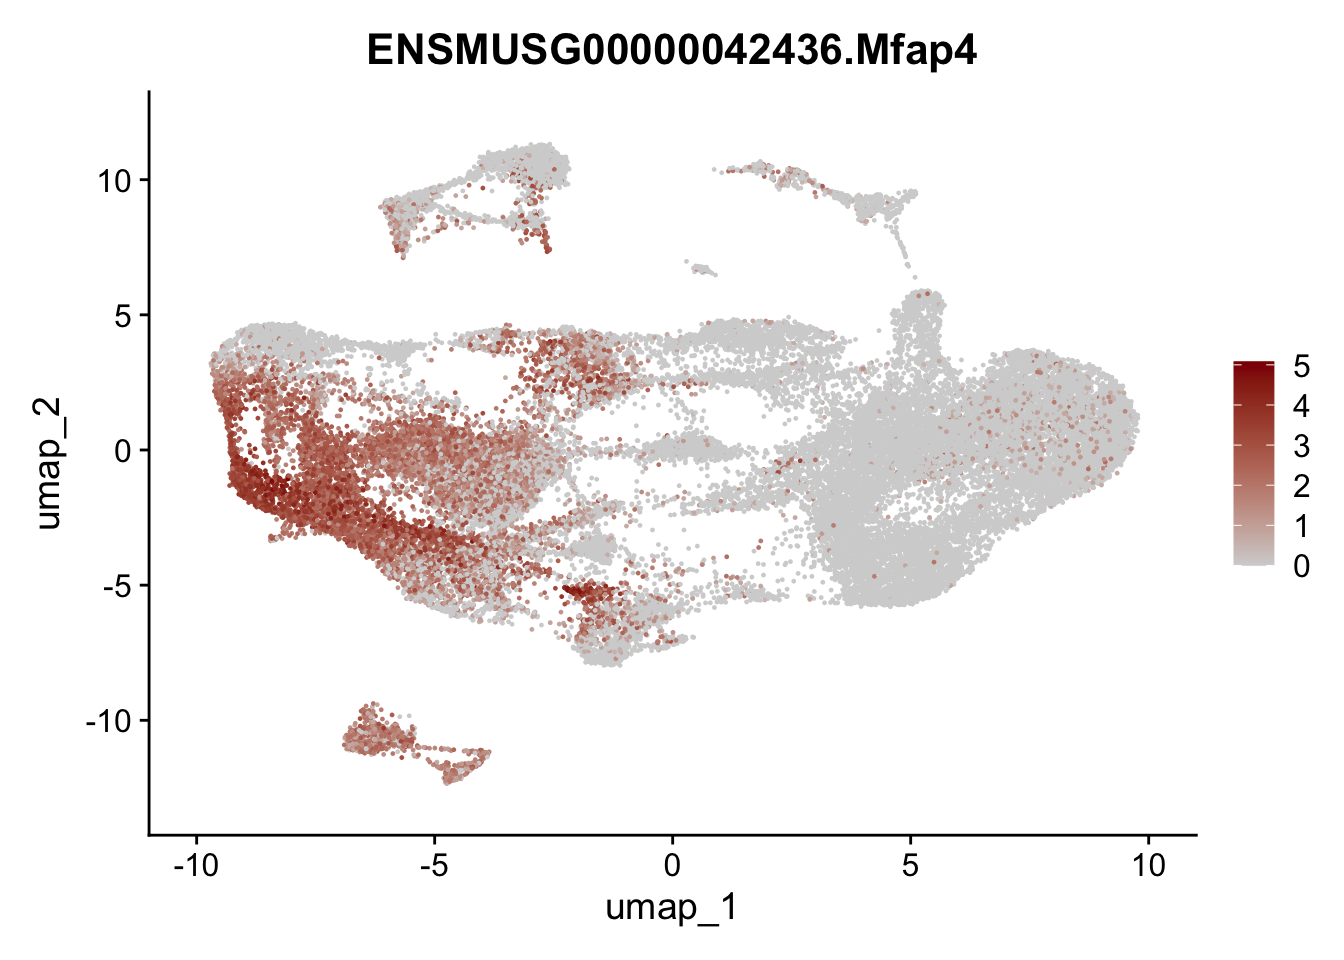
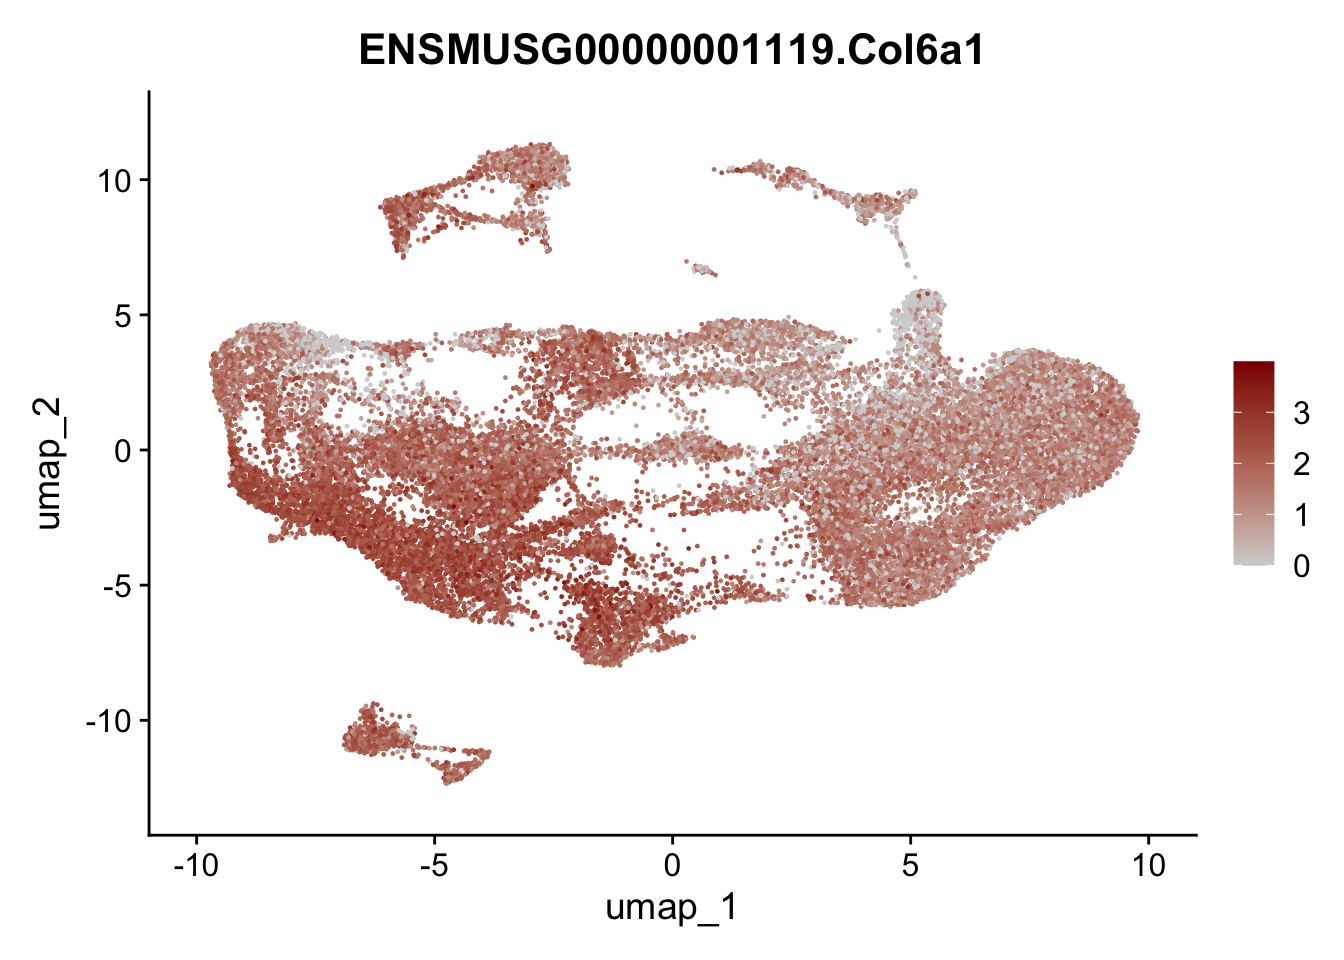
dplyr::filter(p_val_adj < 0.01)features
genes <- data.frame(gene=rownames(seuratmLNf3)) %>%
mutate(geneID=gsub("^.*\\.", "", gene))
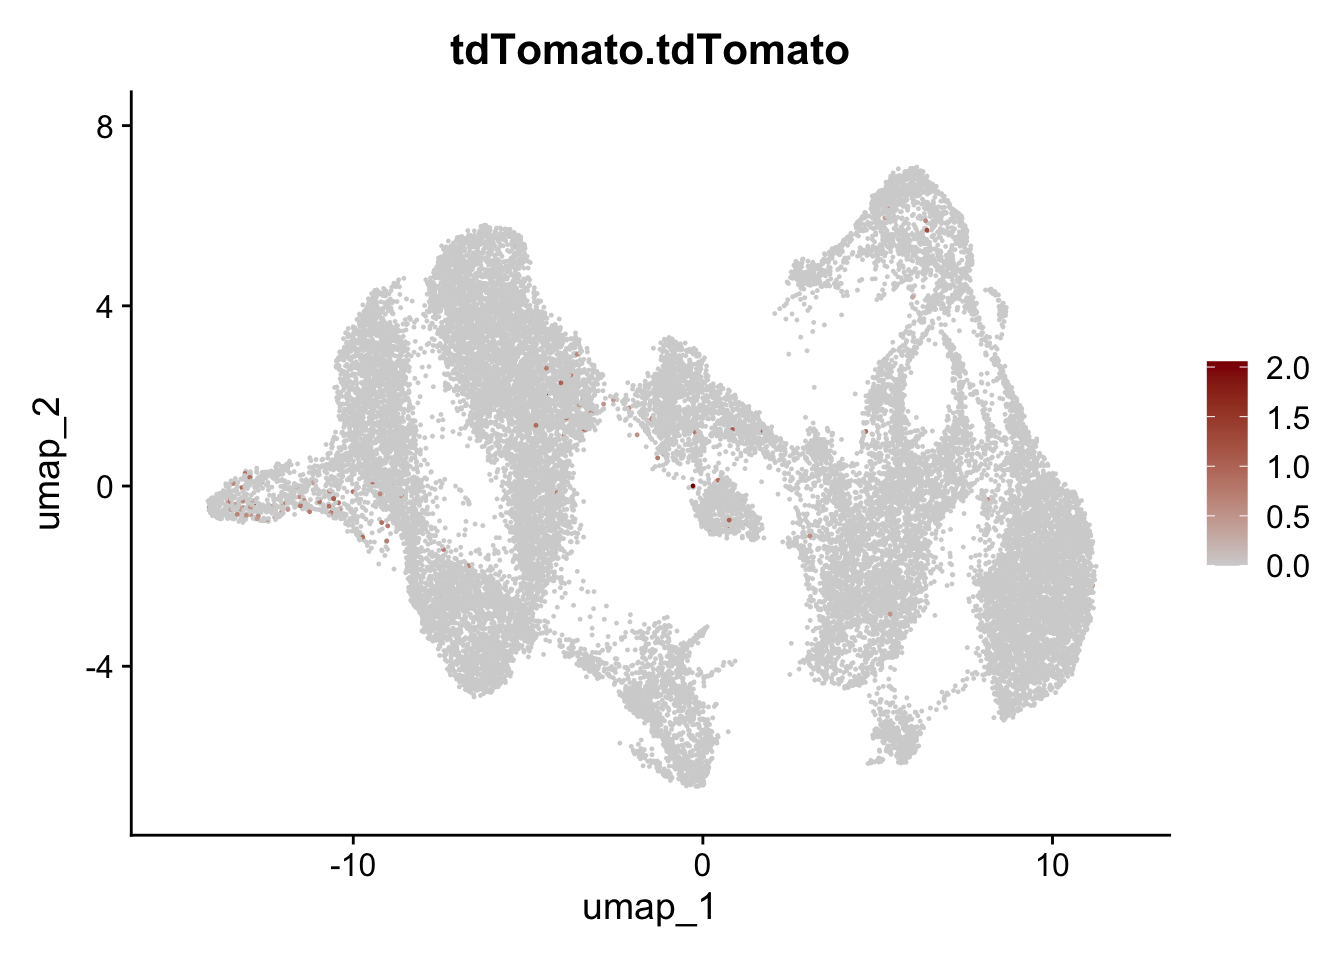
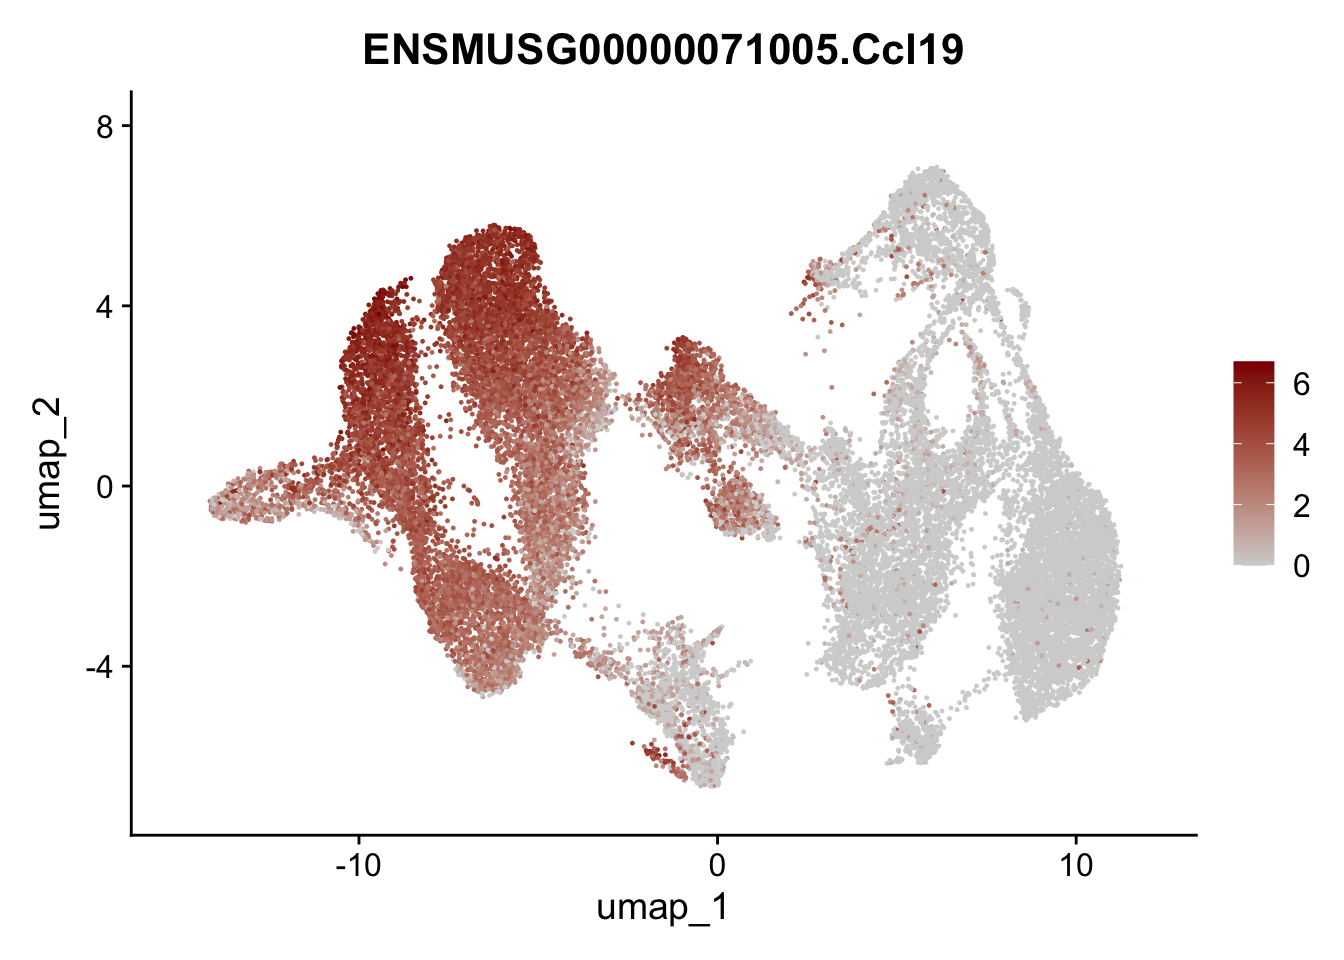
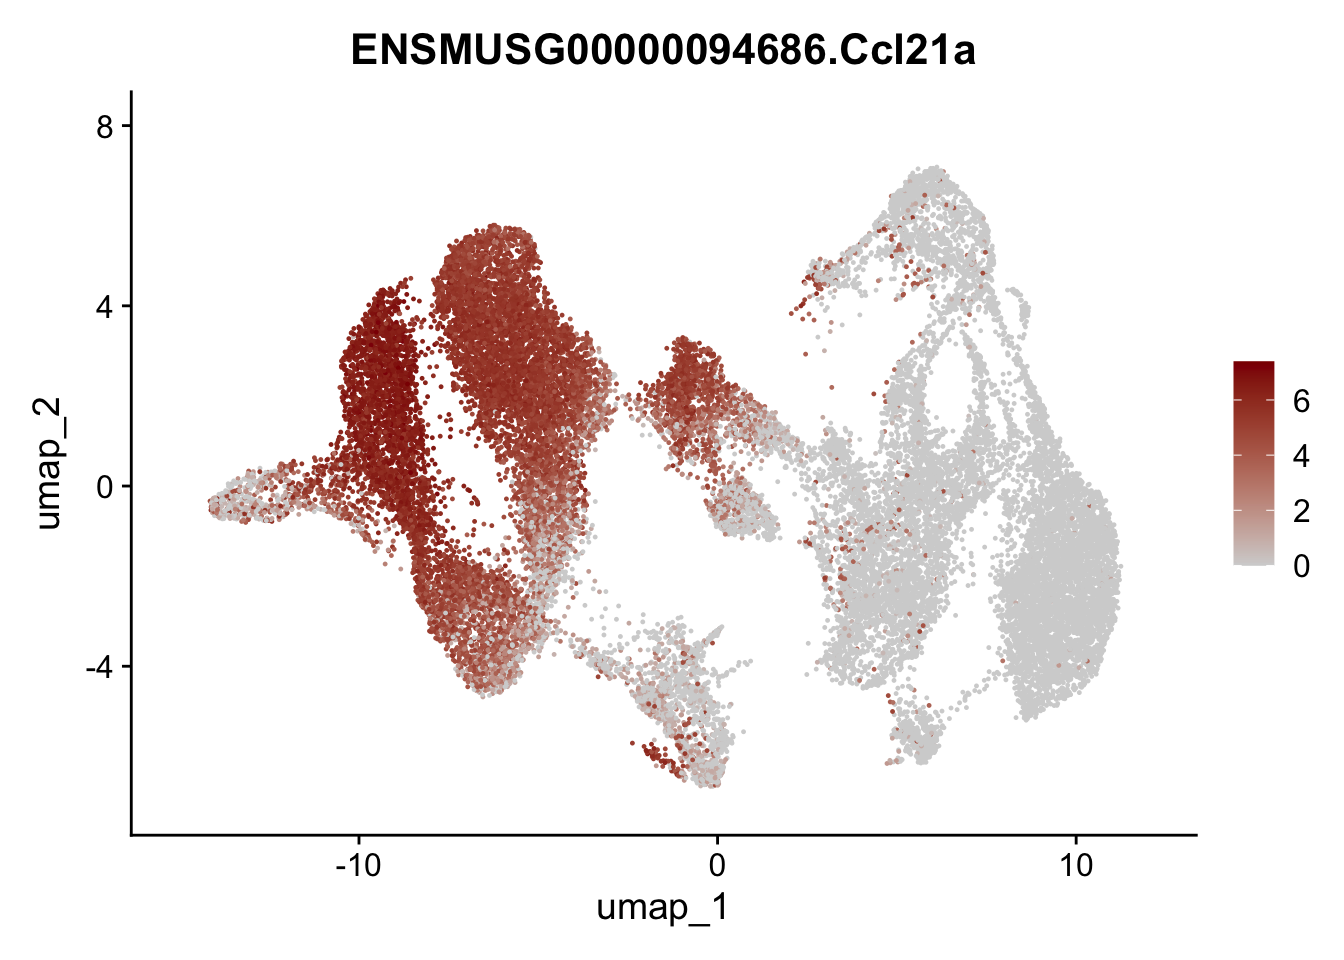
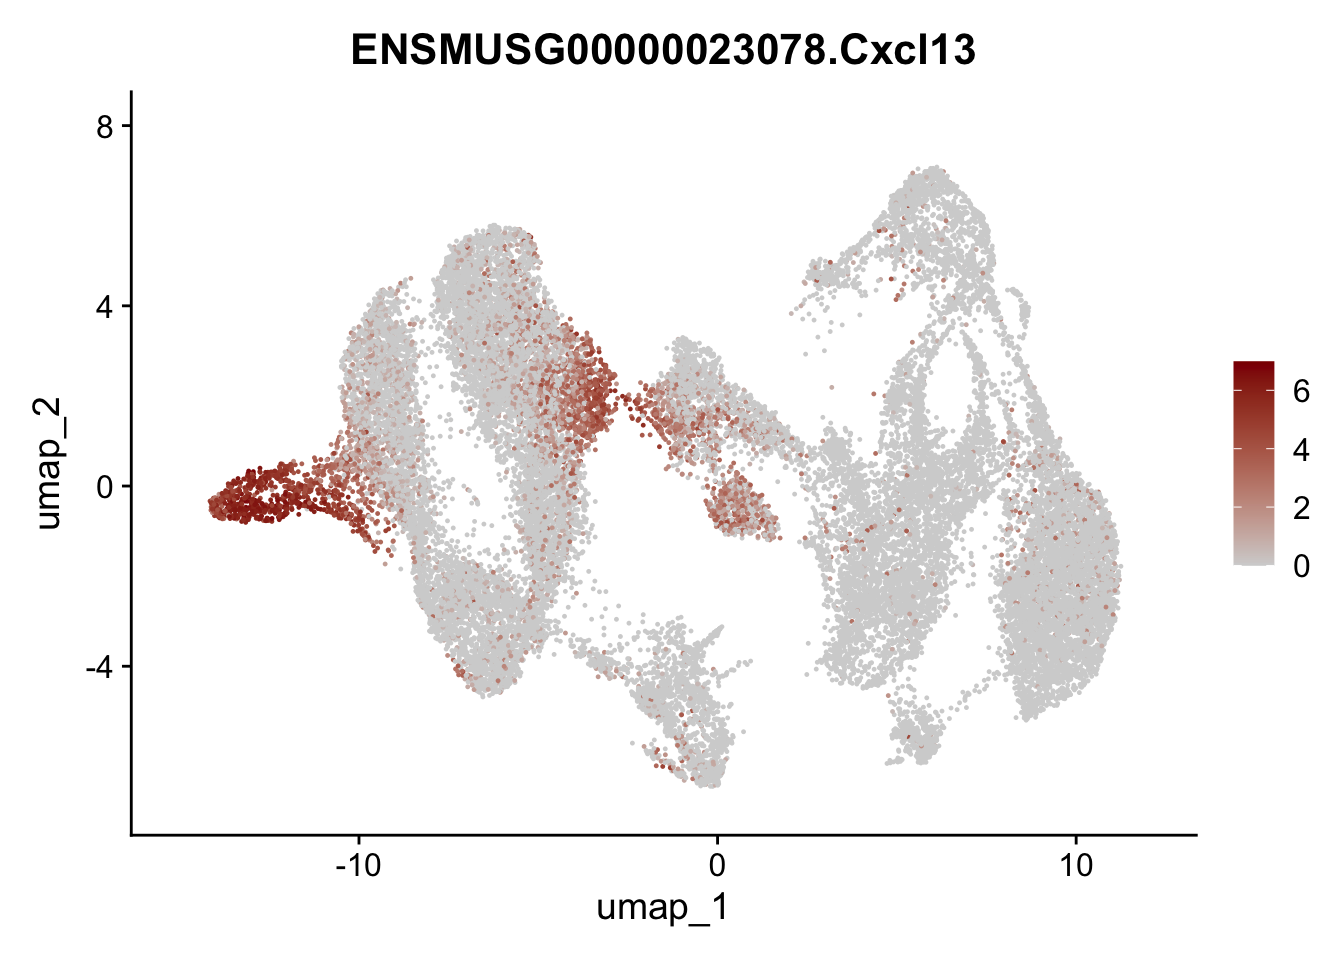
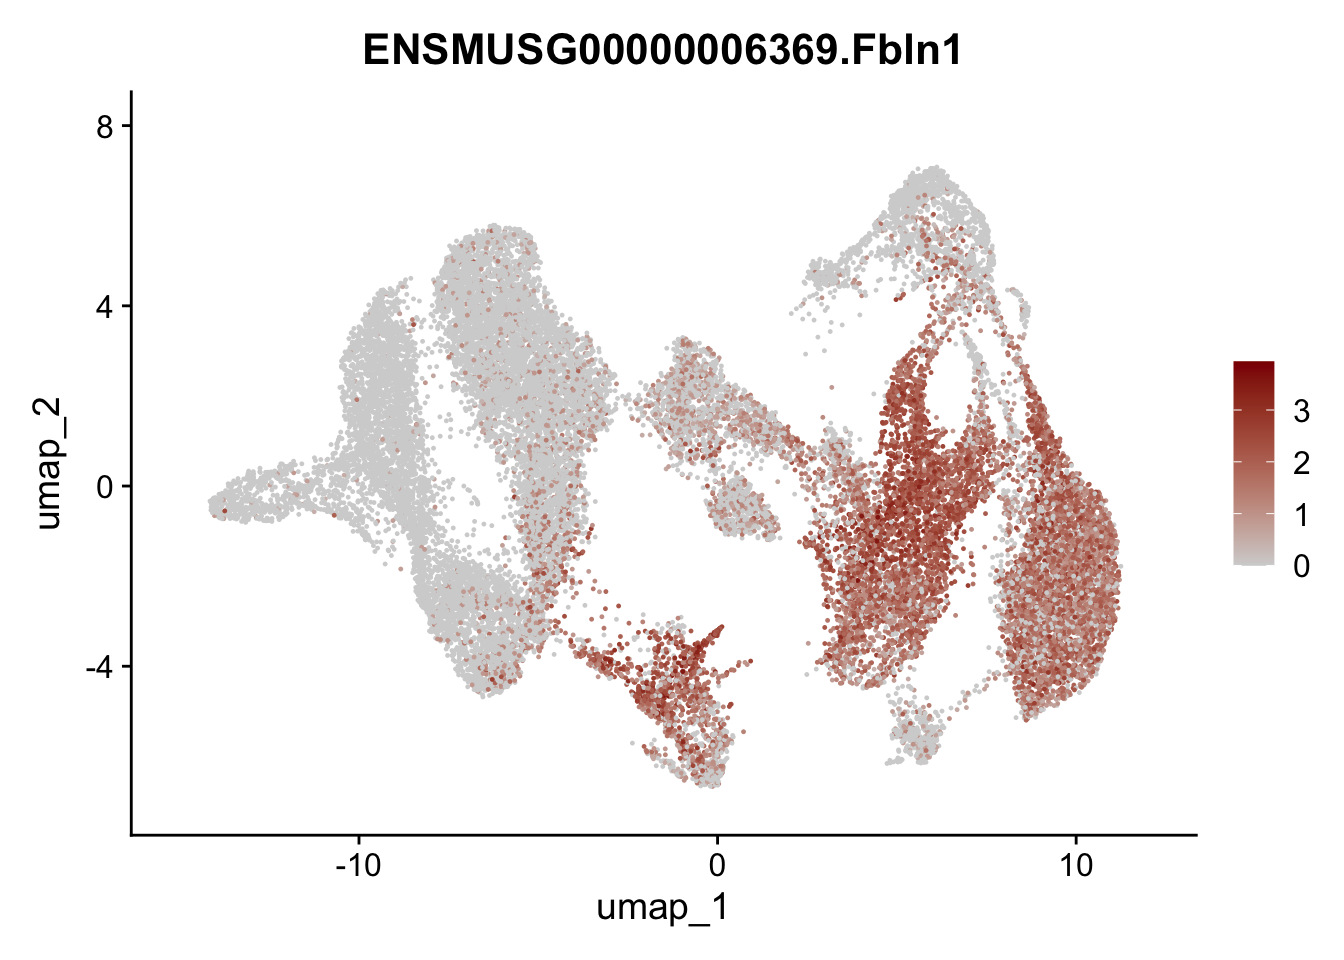
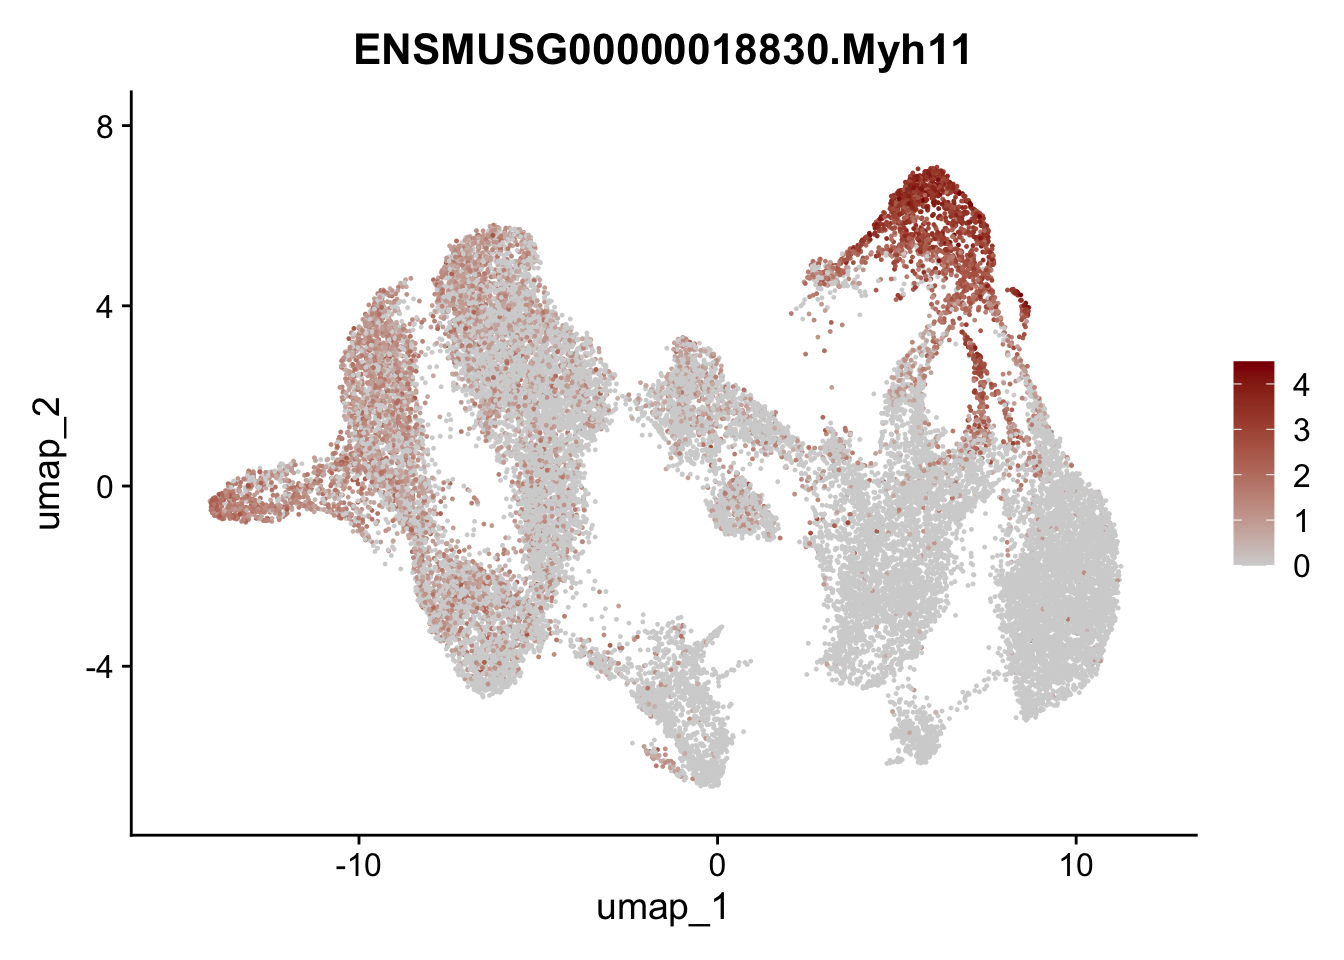
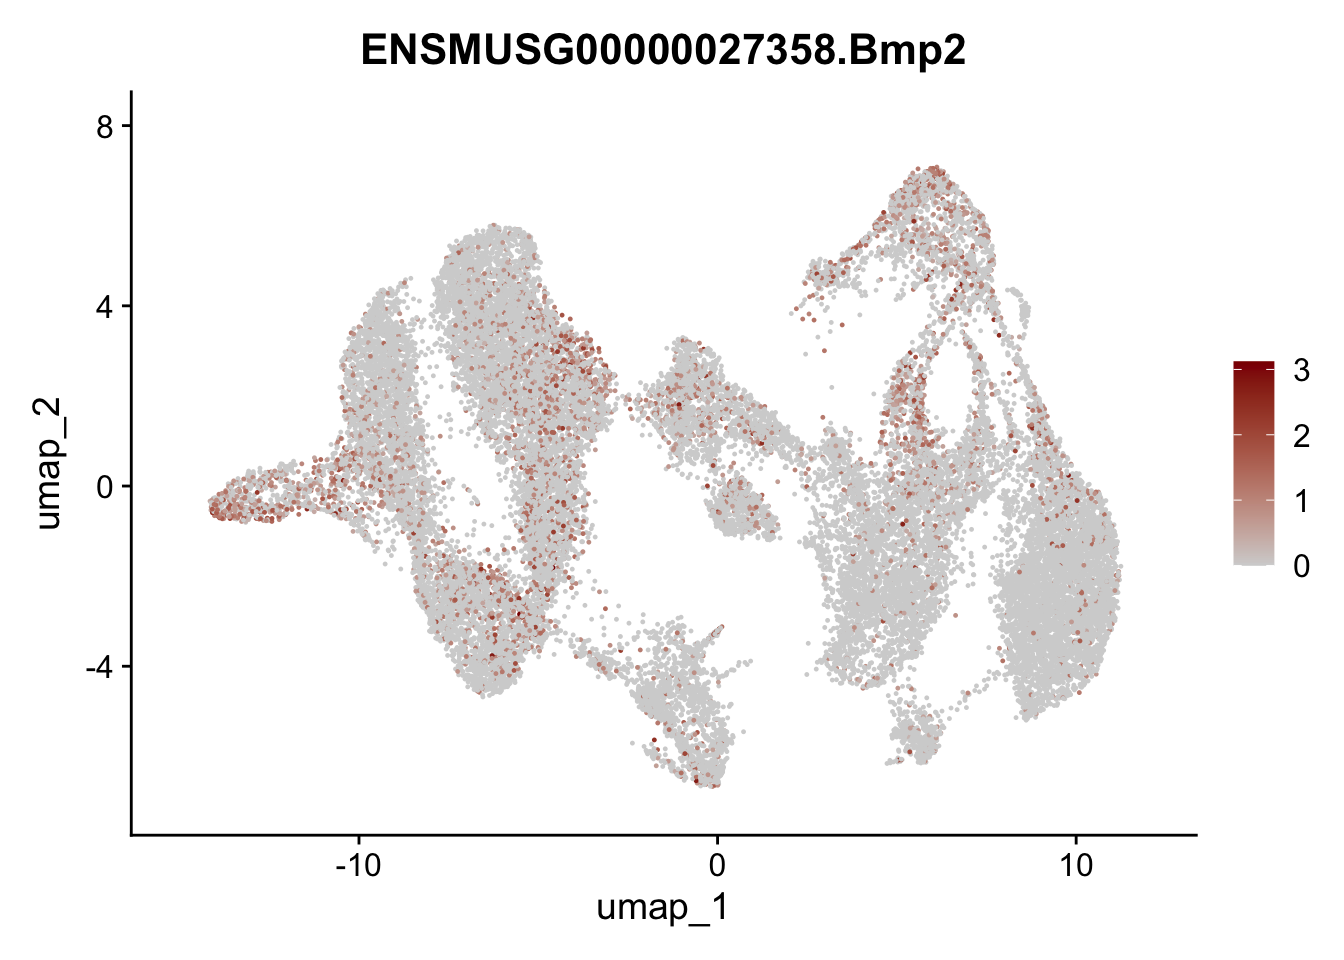
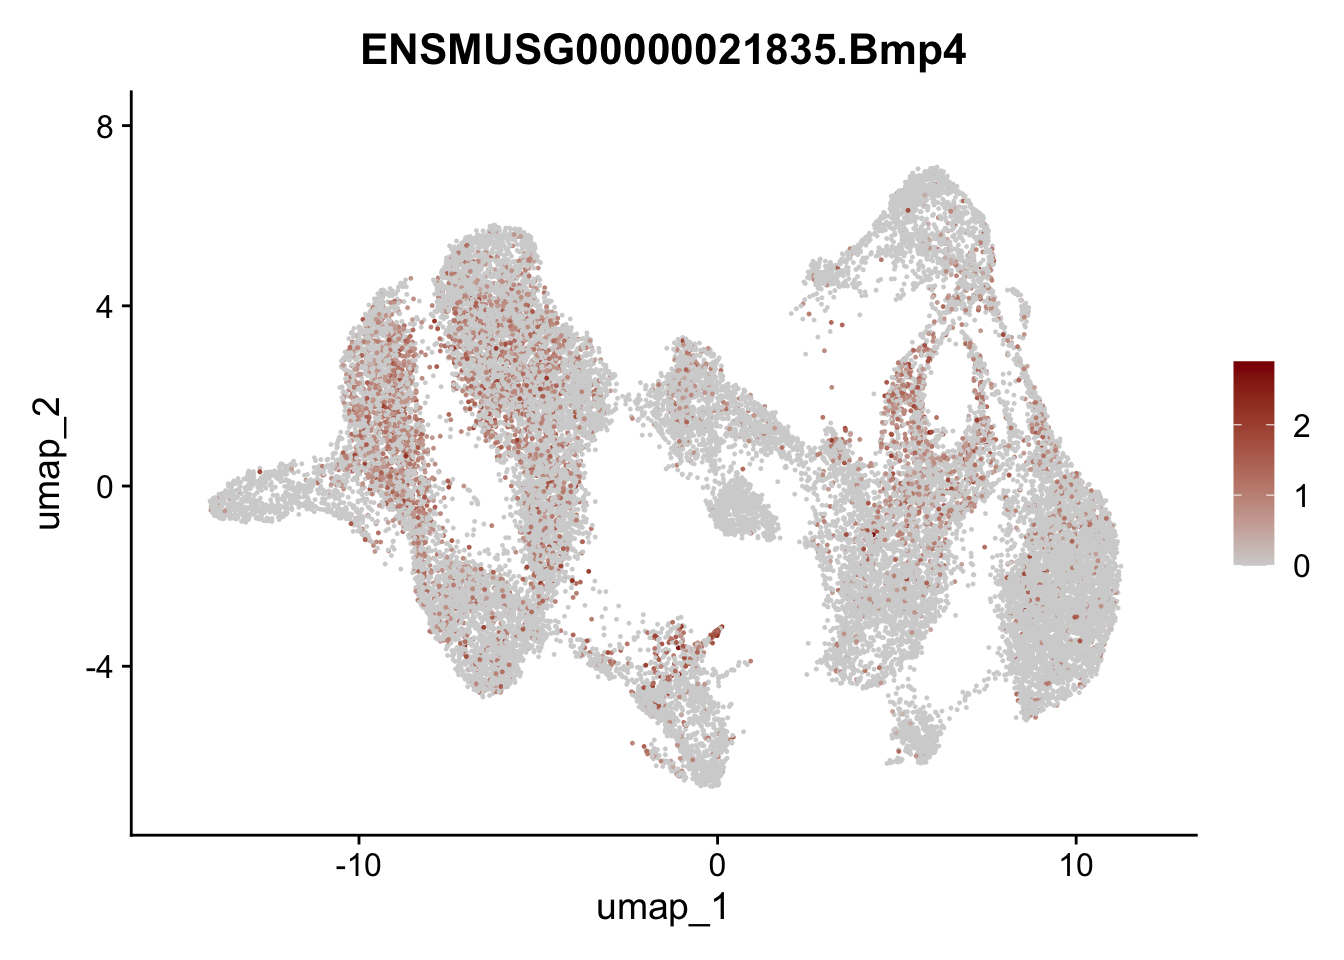
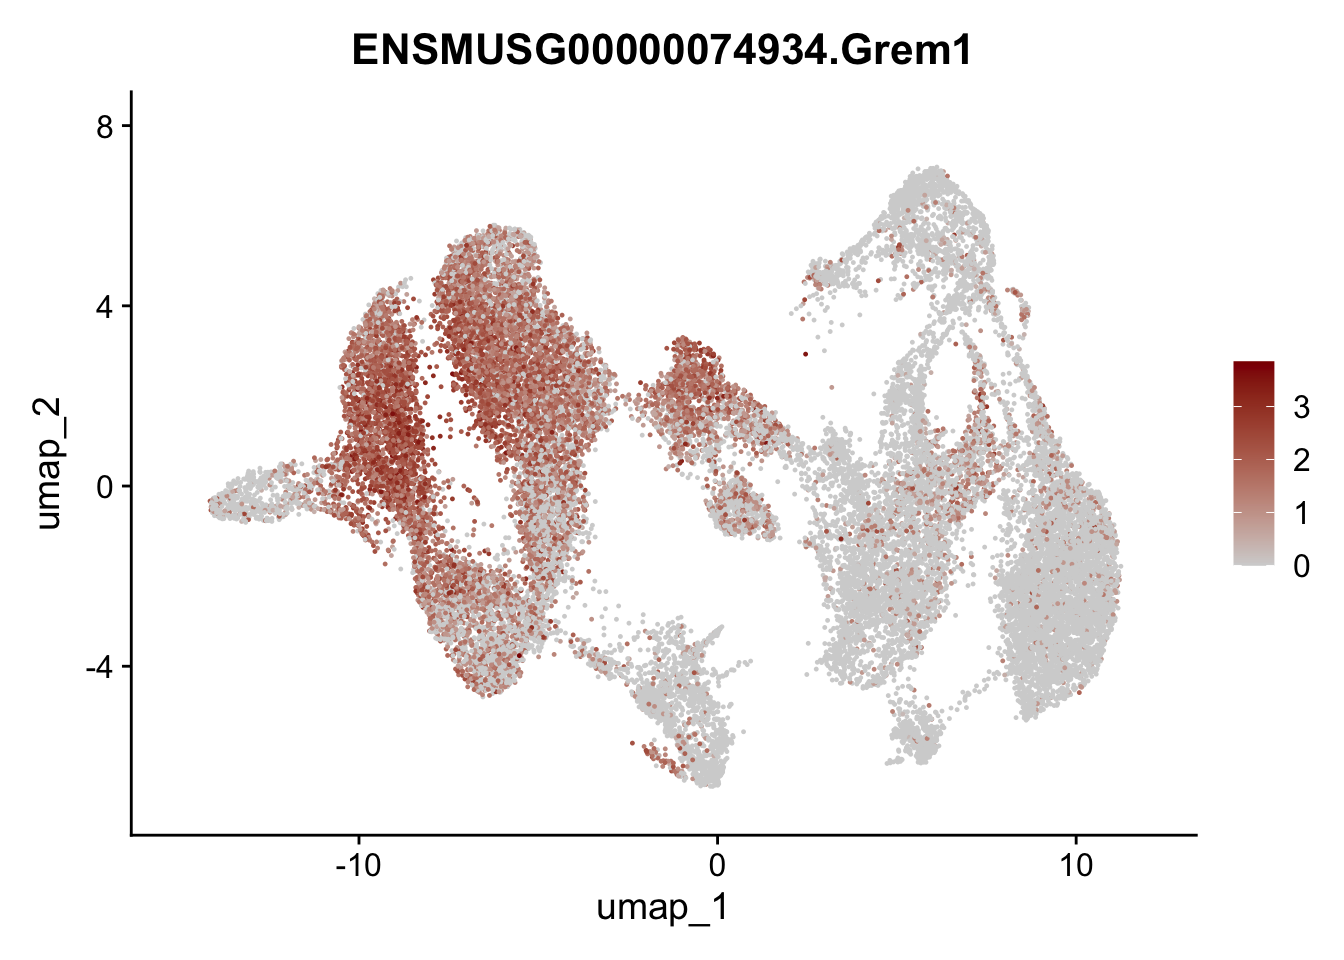
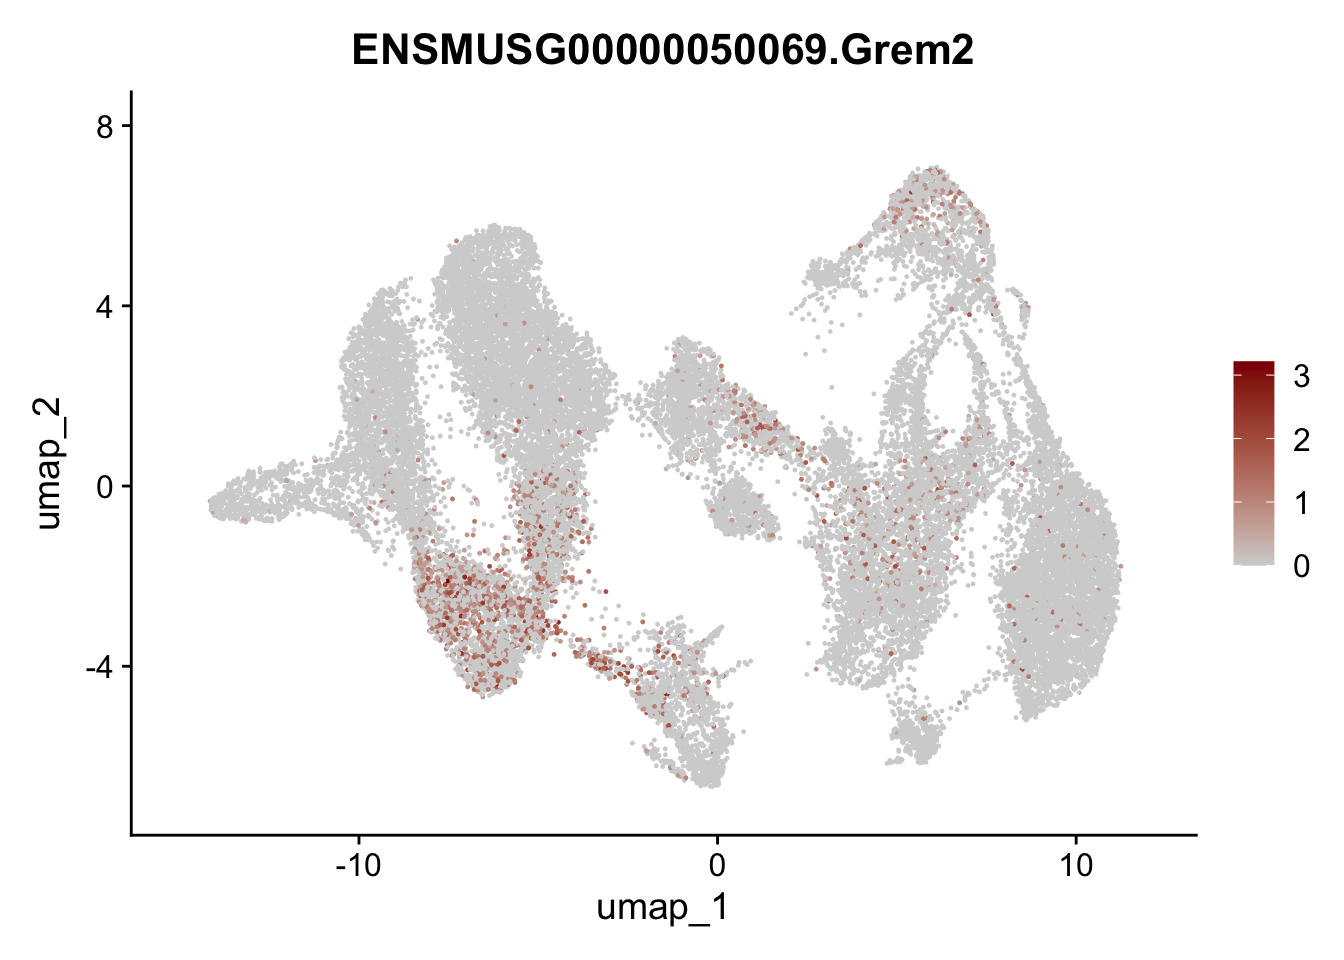
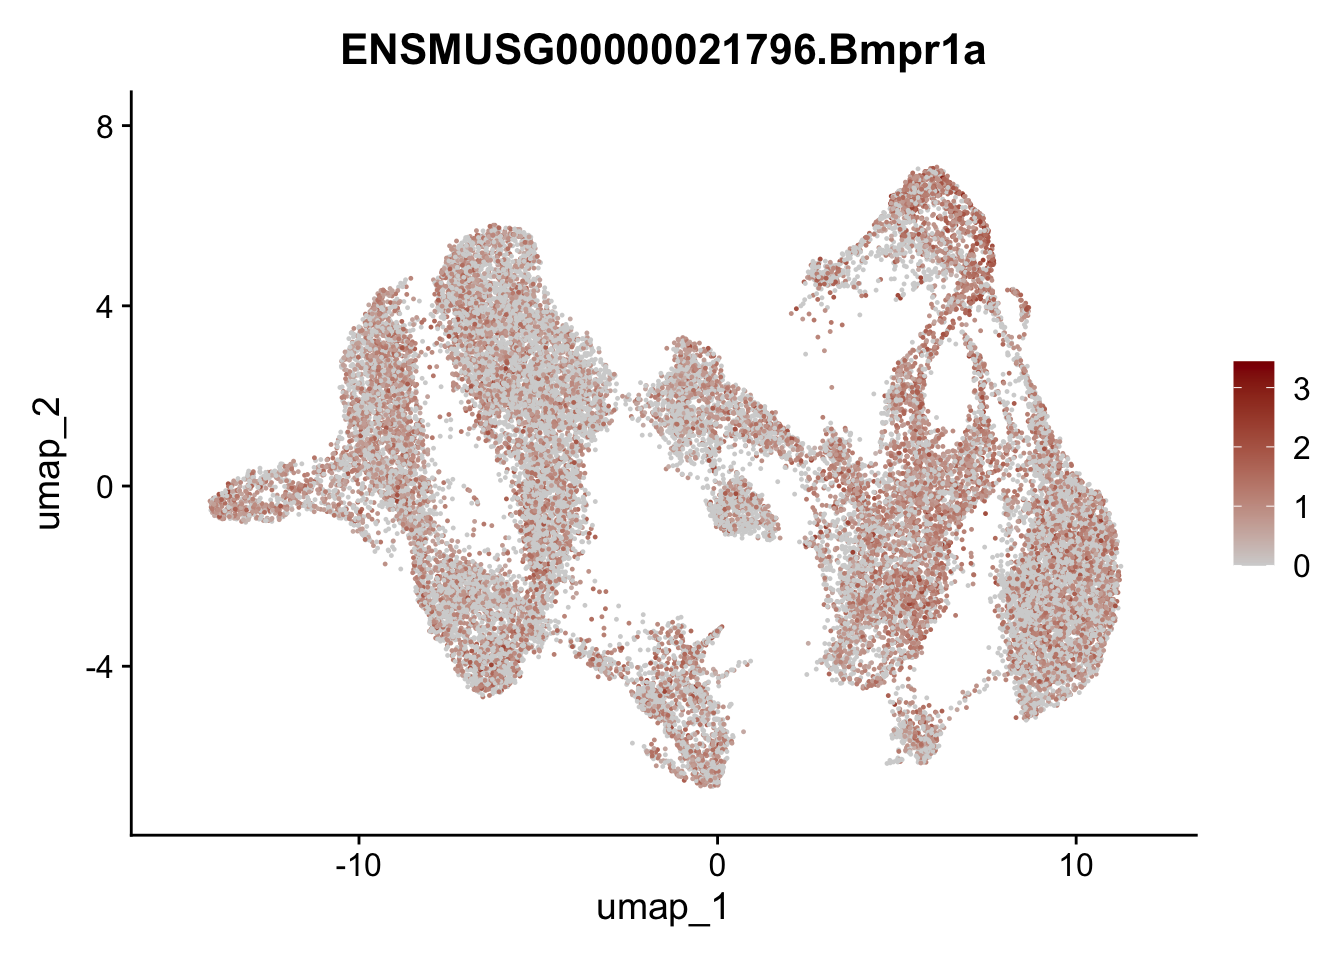
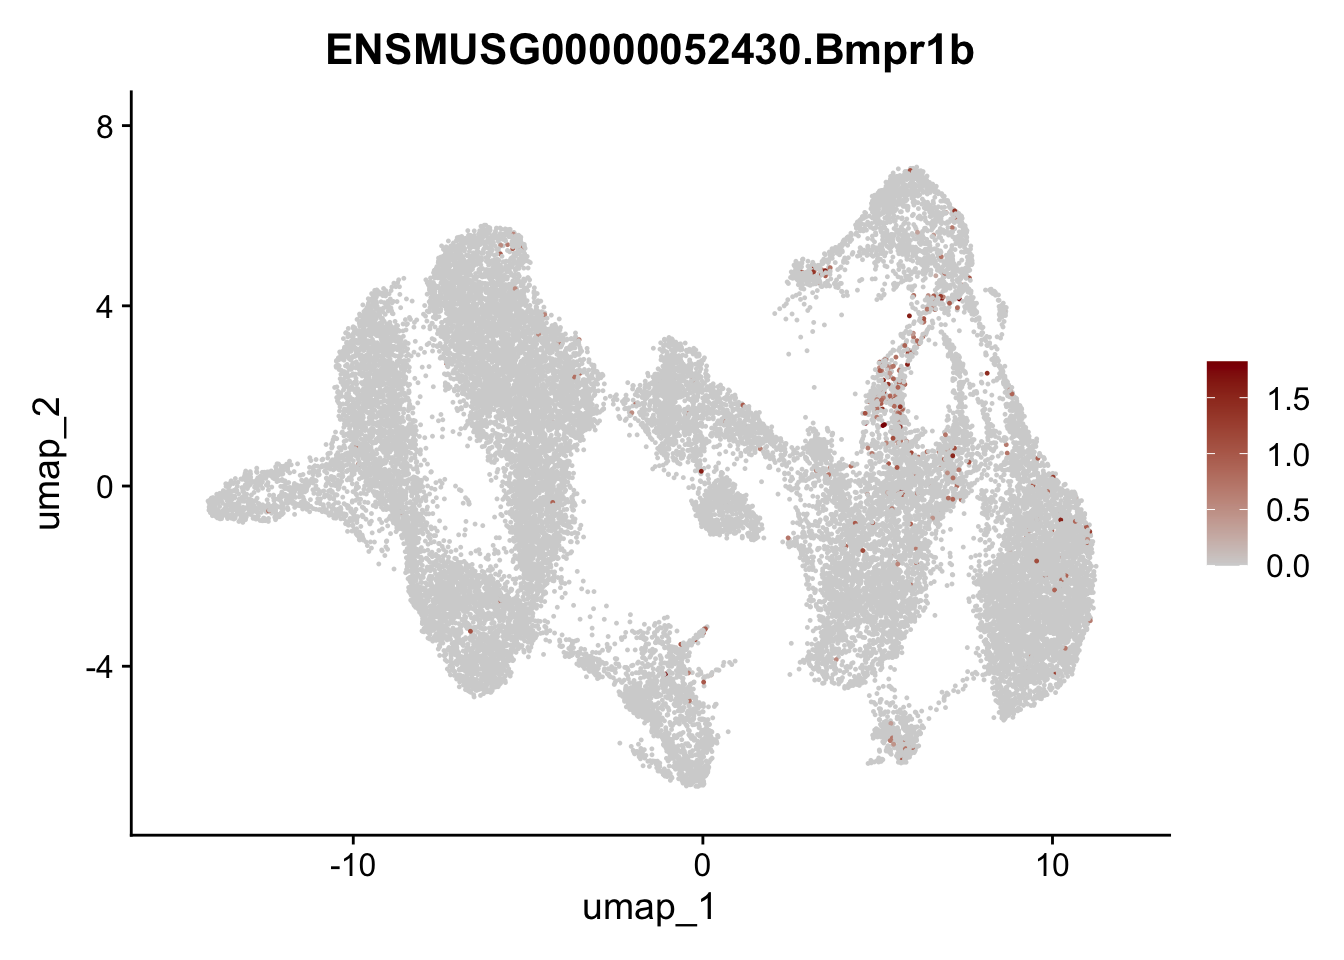
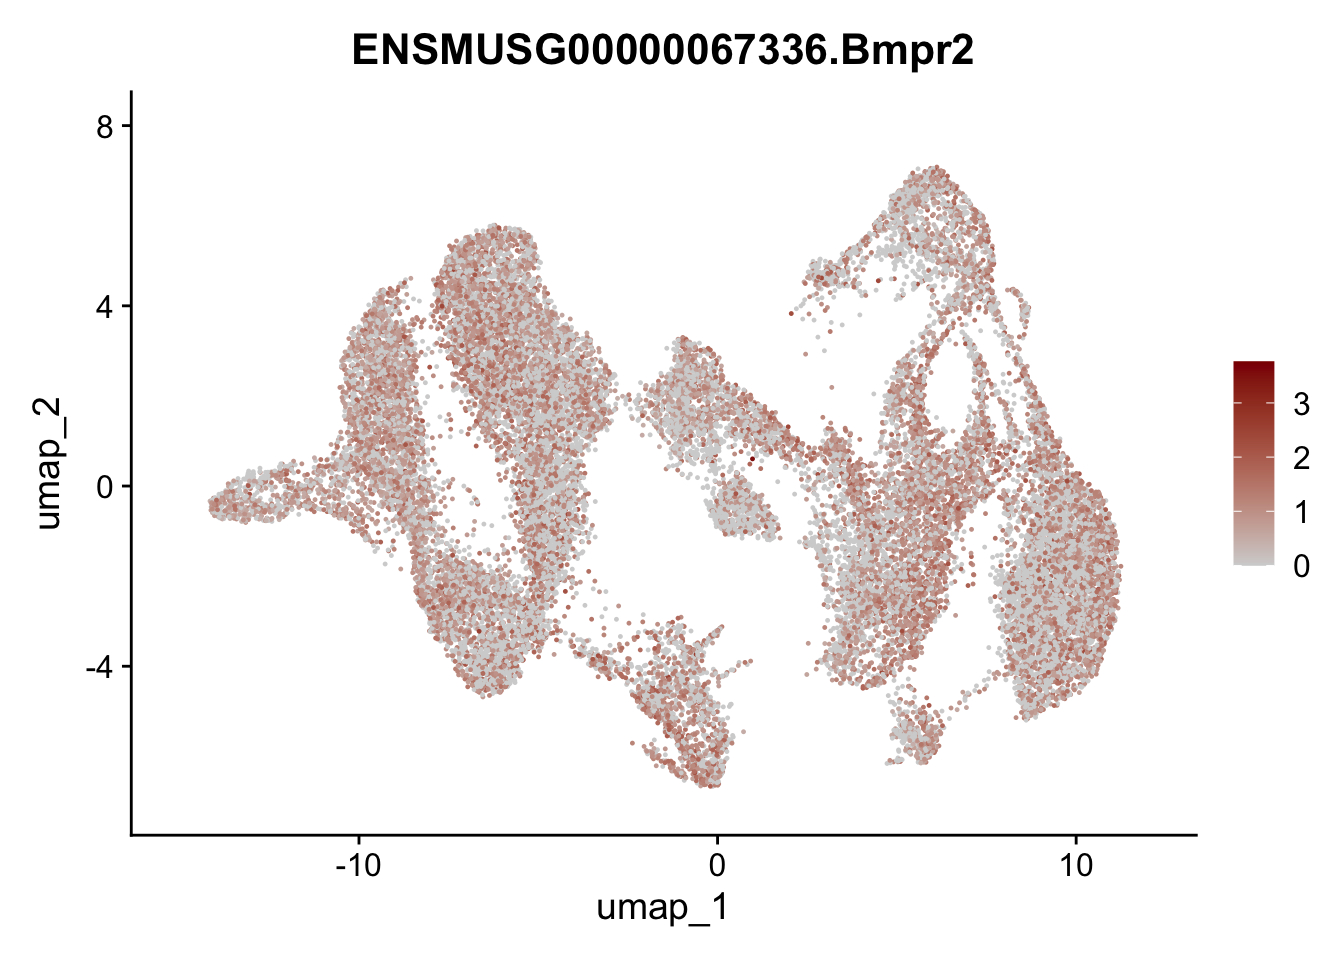
selGenesAll <- data.frame(geneID=c("Rosa26eyfp","tdTomato", "Ccl19", "Ccl21a", "Cxcl13",
"Fbln1", "Col15a1", "Cnn1", "Acta2","Myh11", "Rgs5",
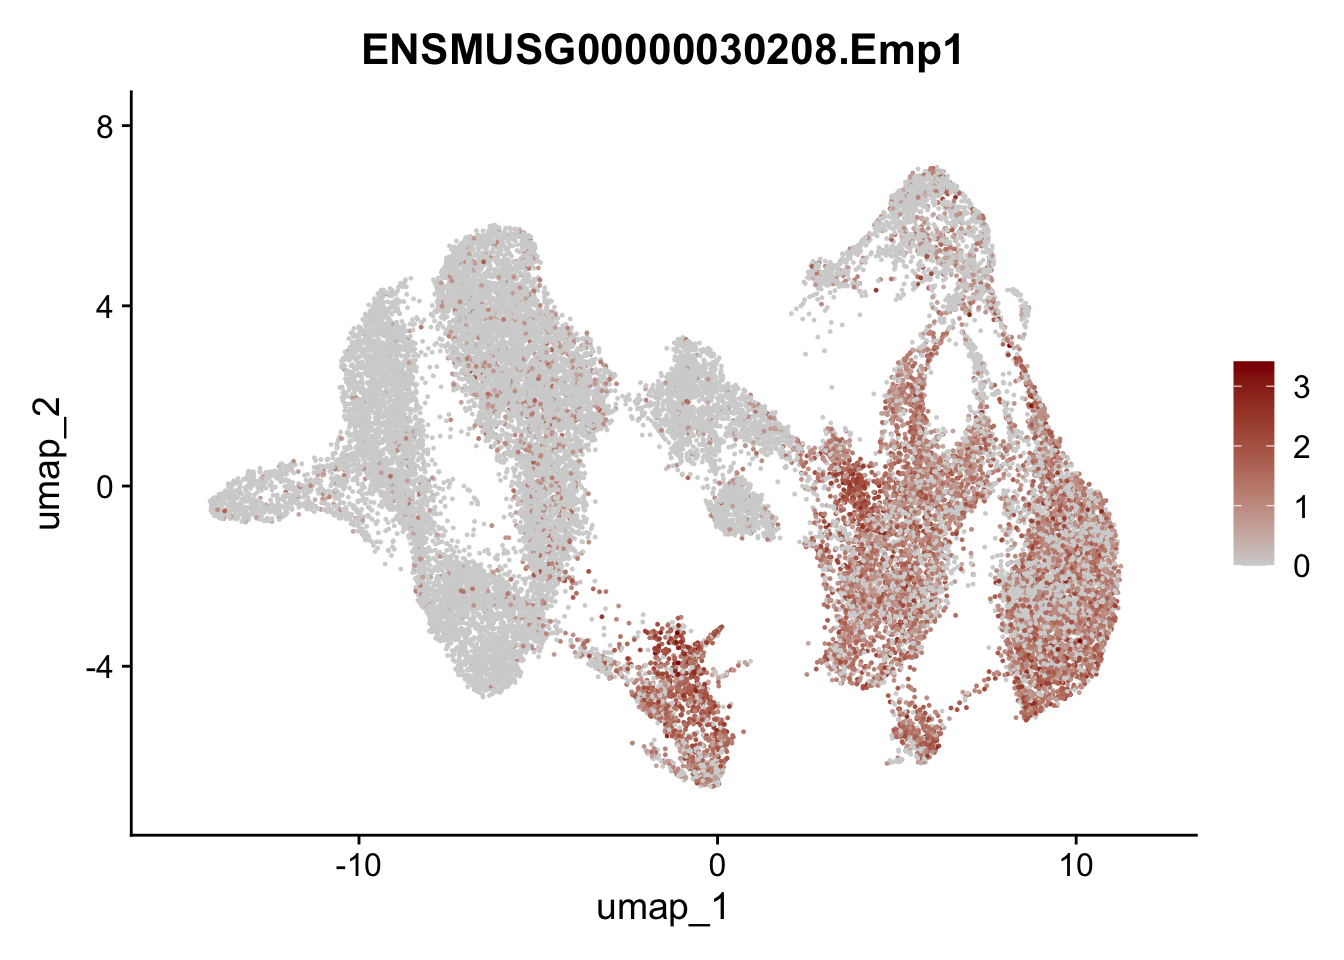
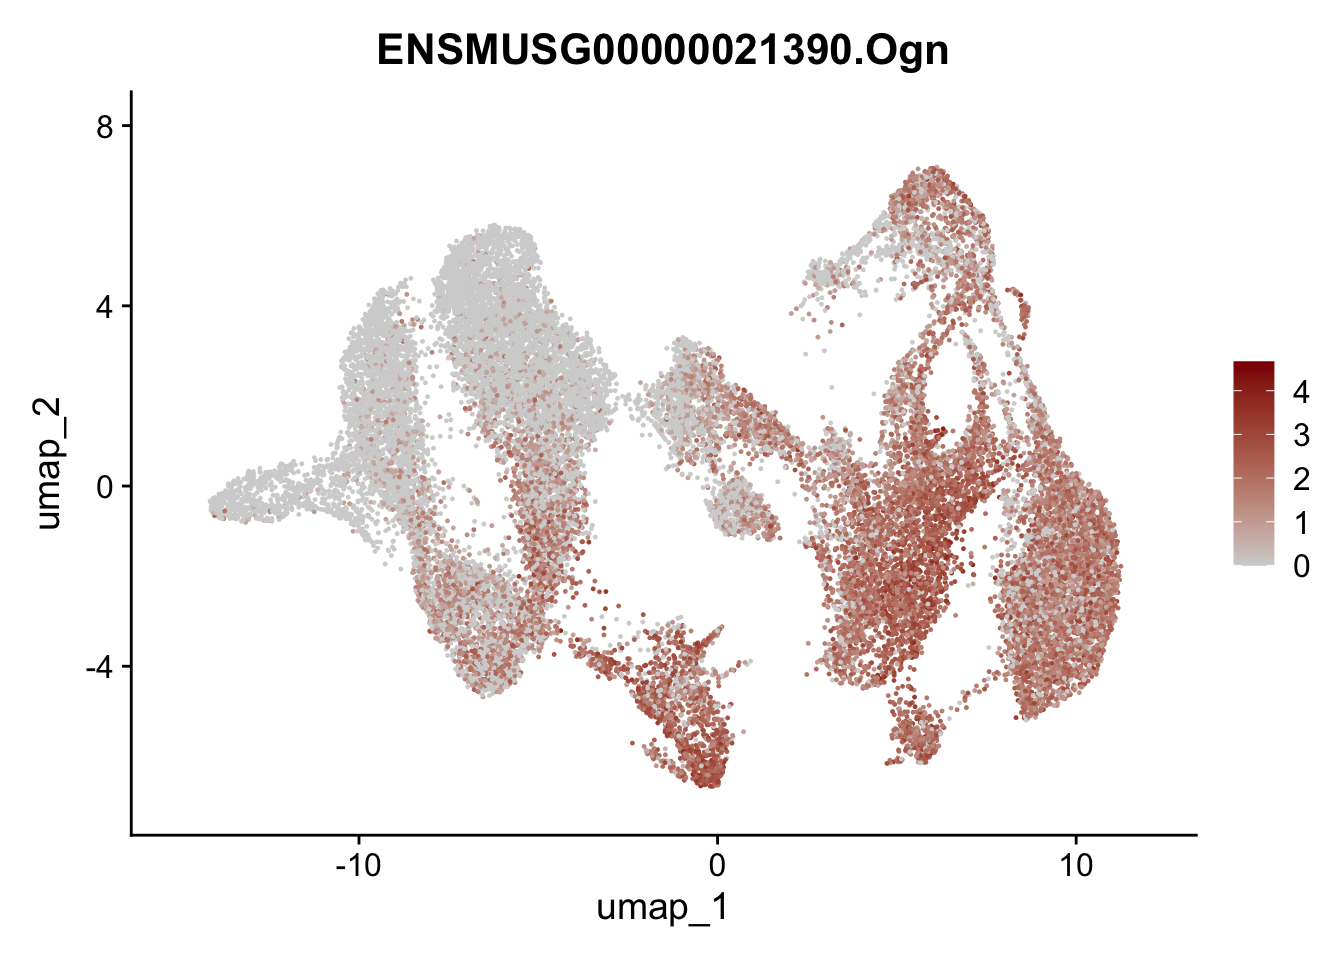
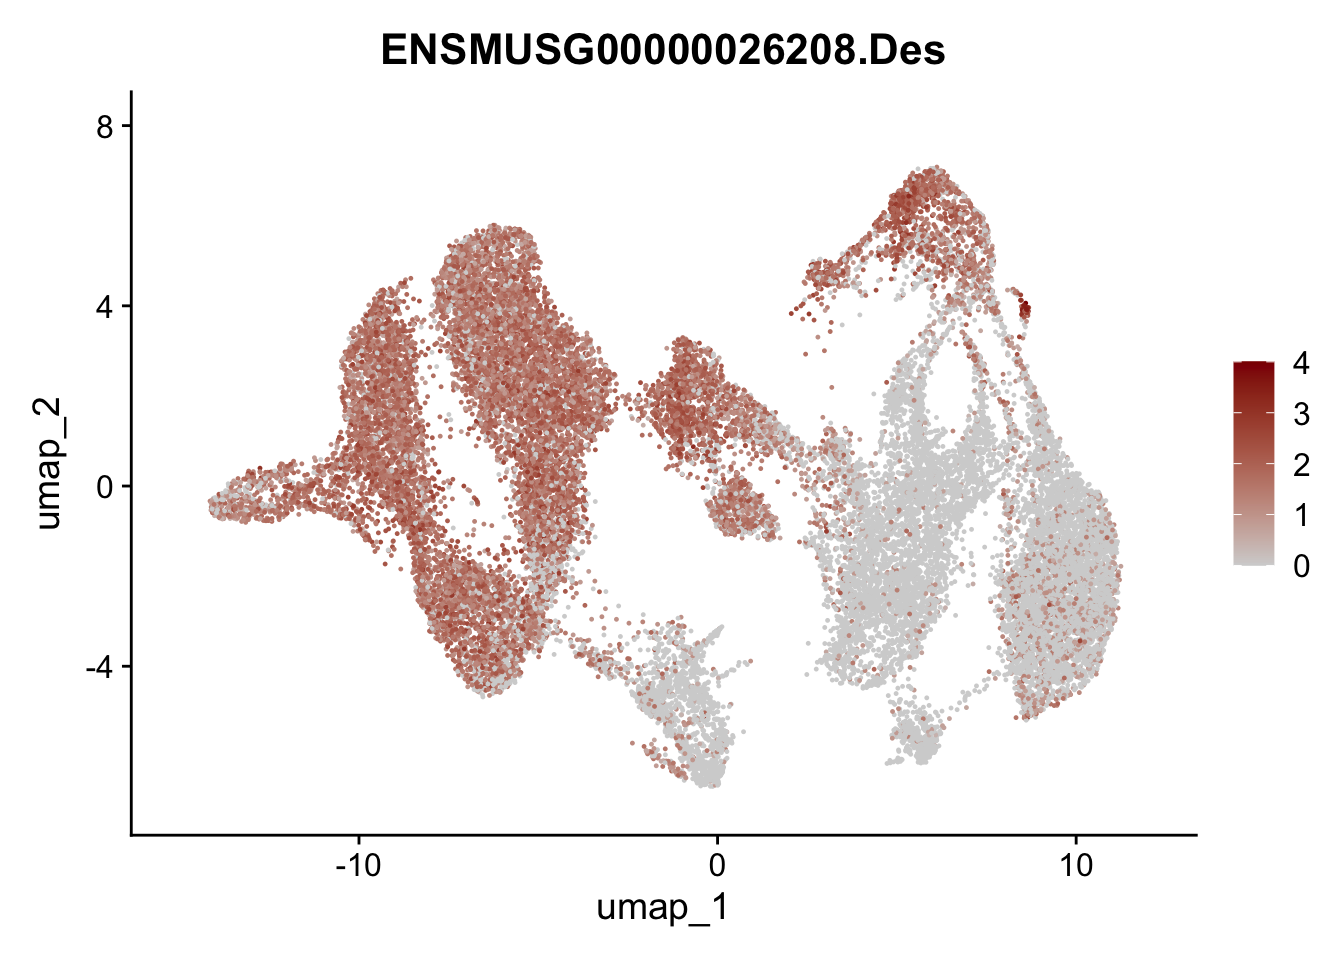
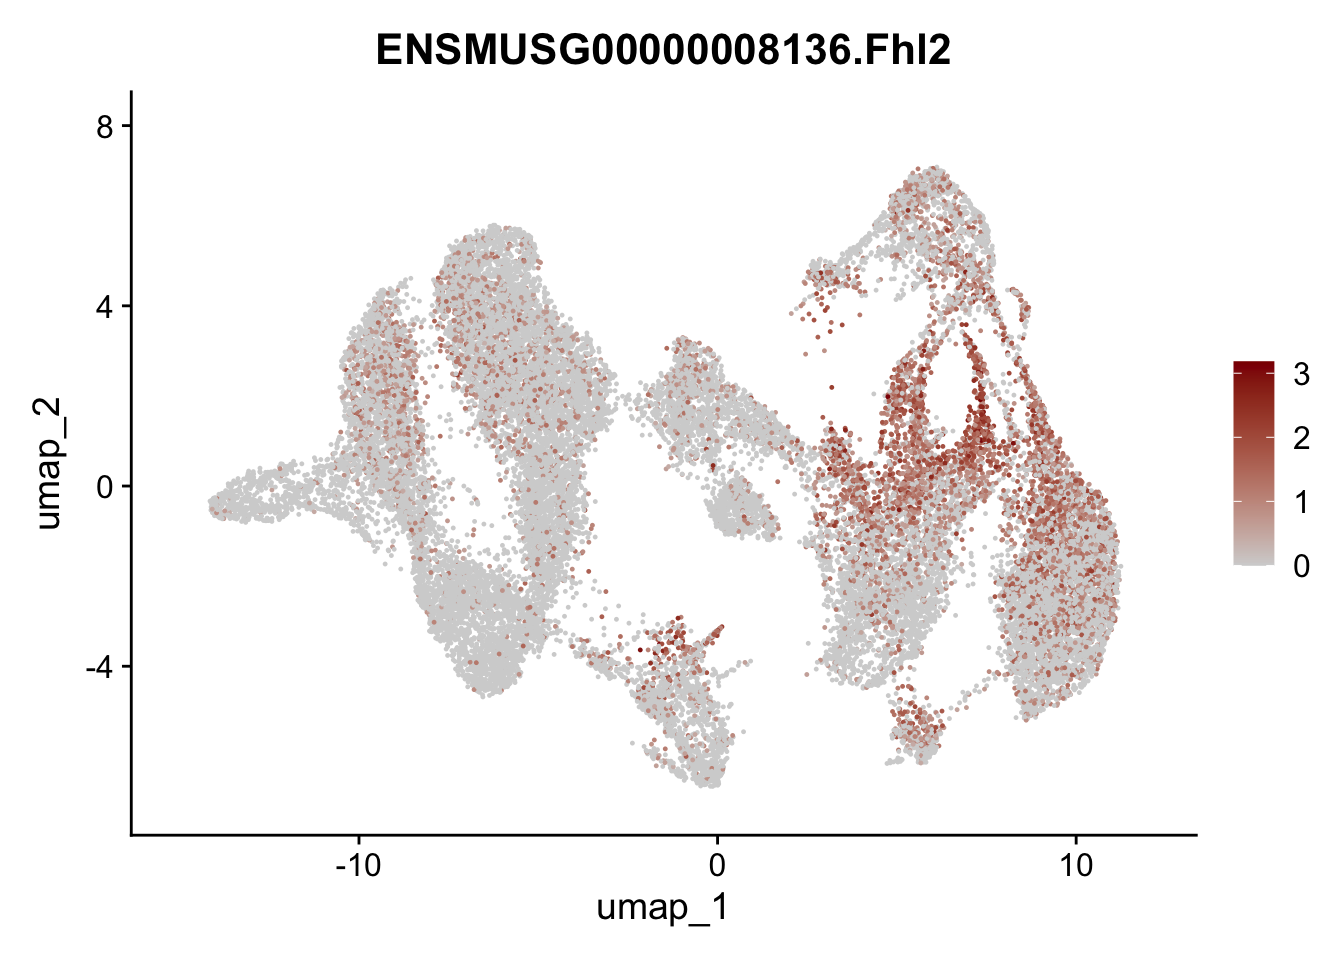
"Cox4i2", "Pi16", "Cd34", "Emp1", "Ogn","Des",
"Fhl2", "Bmp2", "Bmp4", "Grem1", "Grem2", "Bmpr1a", "Bmpr1b", "Bmpr2")) %>%
left_join(., genes, by = "geneID")
pList <- sapply(selGenesAll$gene, function(x){
p <- FeaturePlot(seuratmLNf3, reduction = "umap",
features = x,
cols=c("lightgrey", "darkred"),
order = F) +
theme(legend.position="right")
plot(p)
})
## save object
saveRDS(seuratmLNf3, file=paste0(basedir,"/data/LNmLToRev_EYFP_mLNf3_seurat.rds"))
slingshot
sce <- as.SingleCellExperiment(seuratmLNf3)
sce <- slingshot(sce, clusterLabels = 'RNA_snn_res.0.4', reducedDim = 'UMAP',
                 start.clus = "1", end.clus = c("12", "3", "4", "7", "6"),
                 dist.method="simple", extend = 'n', stretch=0)
load slingshot sce object mLN EYFP+
fileNam <- paste0(basedir, "/data/LNmLToRev_EYFP_mLNf3_slingshot_v2_sce.rds")
scemLNf3v2 <- readRDS(fileNam)
clustDat <- data.frame(clustCol=colPal) %>% rownames_to_column(., "cluster")
timepointDat <- data.frame(ageCol=coltimepoint) %>% rownames_to_column(., "timepoint")
colDat <- data.frame(cluster=scemLNf3v2$RNA_snn_res.0.4) %>%
mutate(timepoint=scemLNf3v2$timepoint) %>% left_join(., clustDat, by="cluster") %>%
left_join(., timepointDat, by="timepoint")plot(reducedDims(scemLNf3v2)$UMAP, col = colDat$clustCol, pch=16, asp = 1)
lines(SlingshotDataSet(scemLNf3v2), lwd=2, type = 'lineages', col = 'black')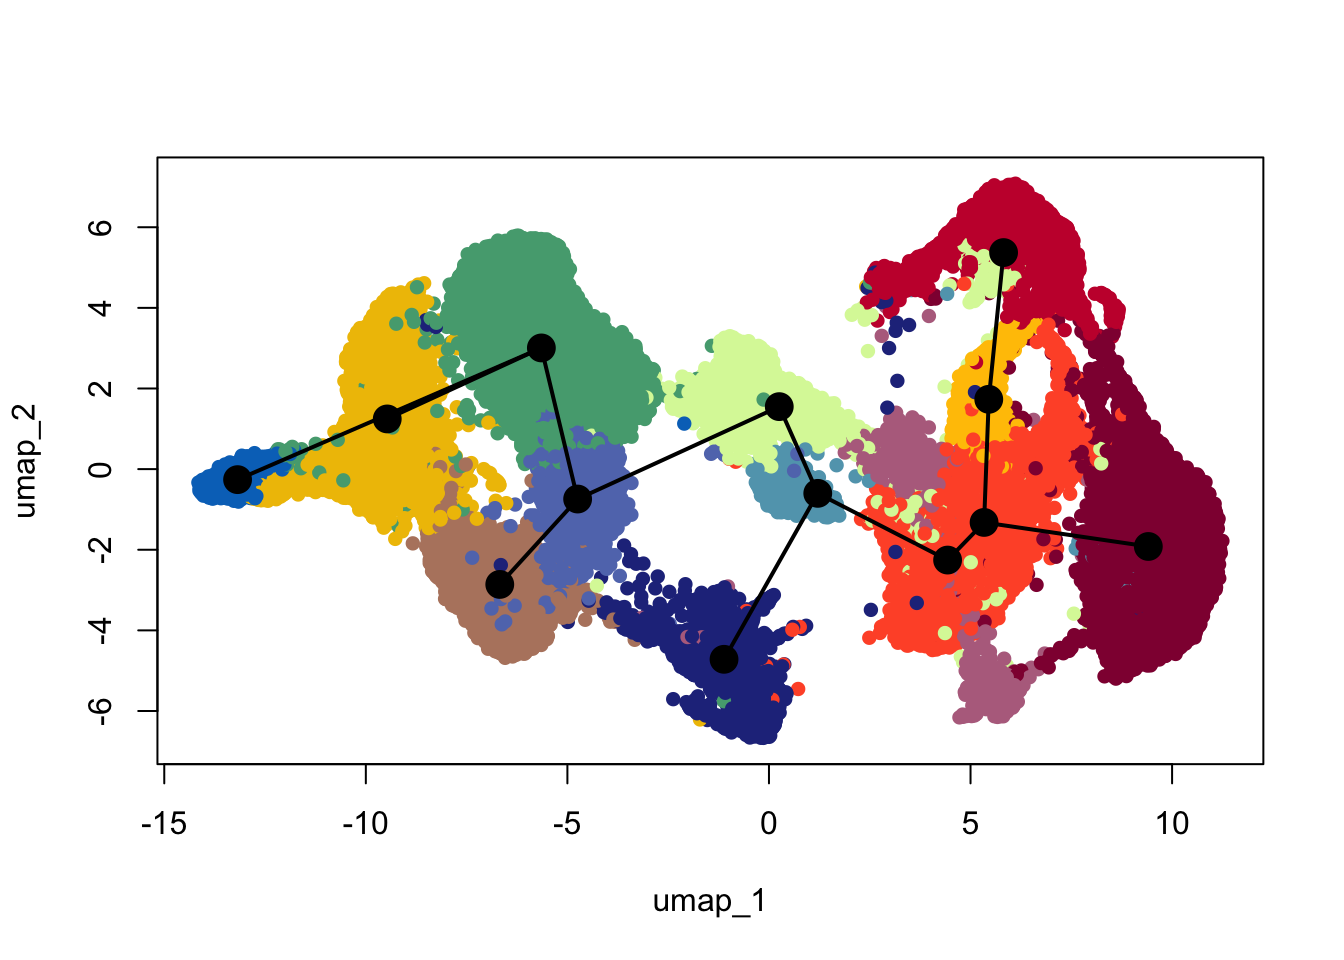
plot(reducedDims(scemLNf3v2)$UMAP, col = colDat$ageCol, pch=16, asp = 1)
lines(SlingshotDataSet(scemLNf3v2), lwd=2, type = 'lineages', col = 'black')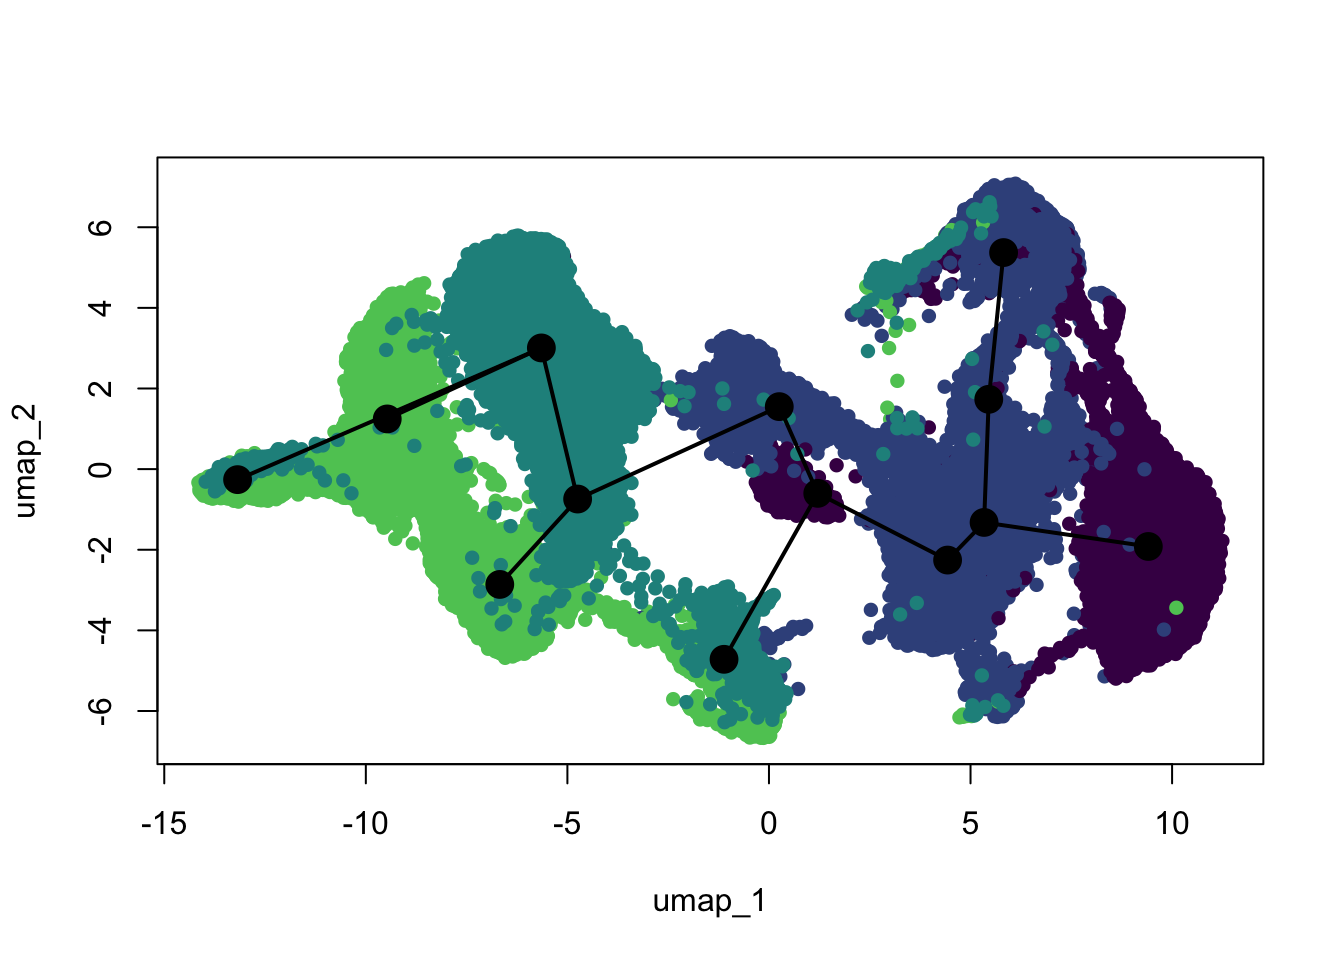
plot(reducedDims(scemLNf3v2)$UMAP, col = colDat$clustCol, pch=16, asp = 1)
lines(SlingshotDataSet(scemLNf3v2), lwd=2, col='black')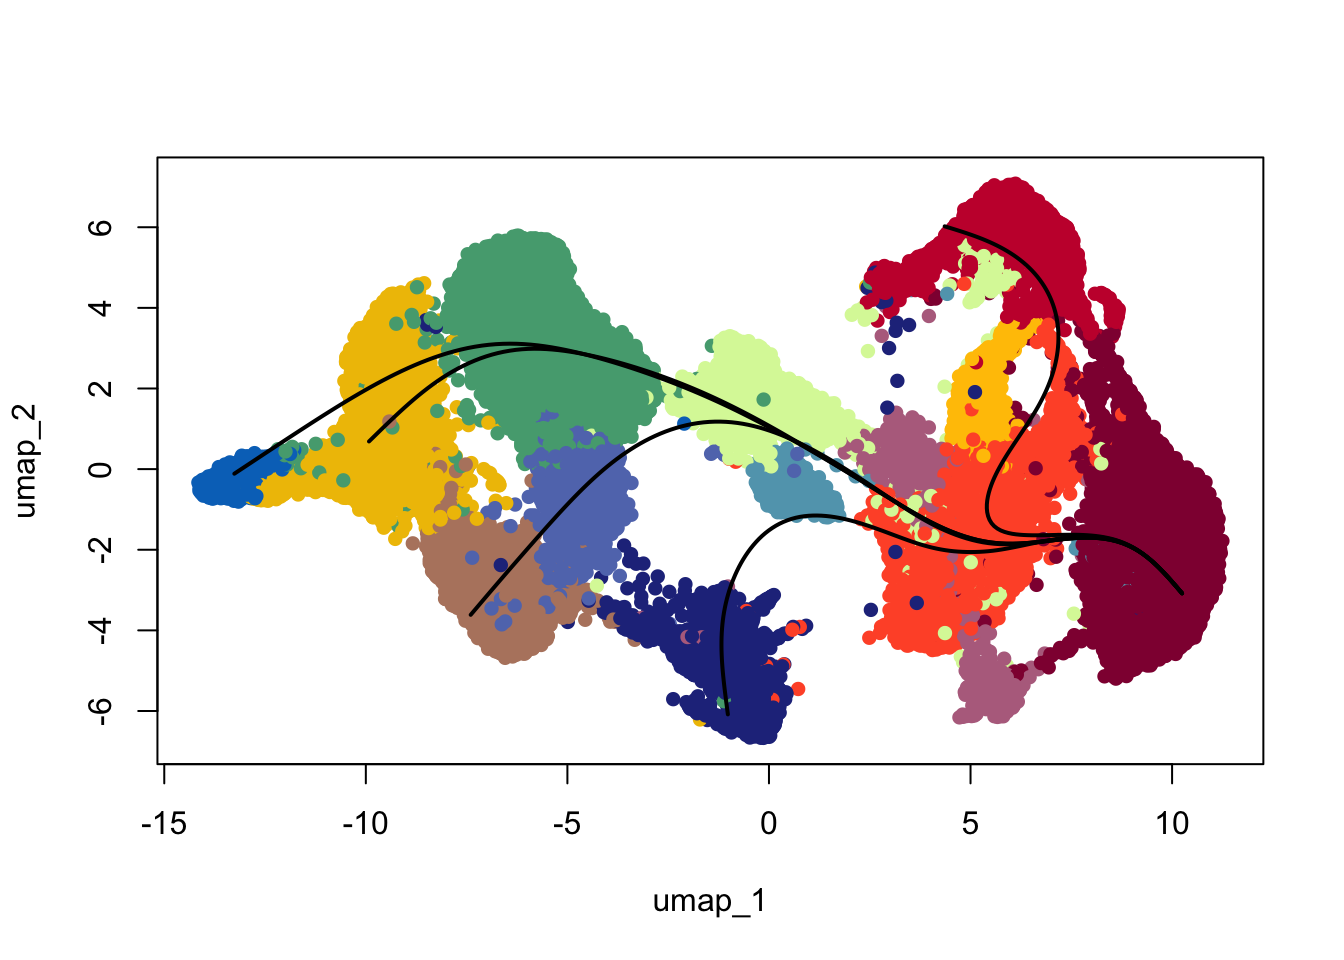
plot(reducedDims(scemLNf3v2)$UMAP, col = colDat$ageCol, pch=16, asp = 1)
lines(SlingshotDataSet(scemLNf3v2), lwd=2, col='black')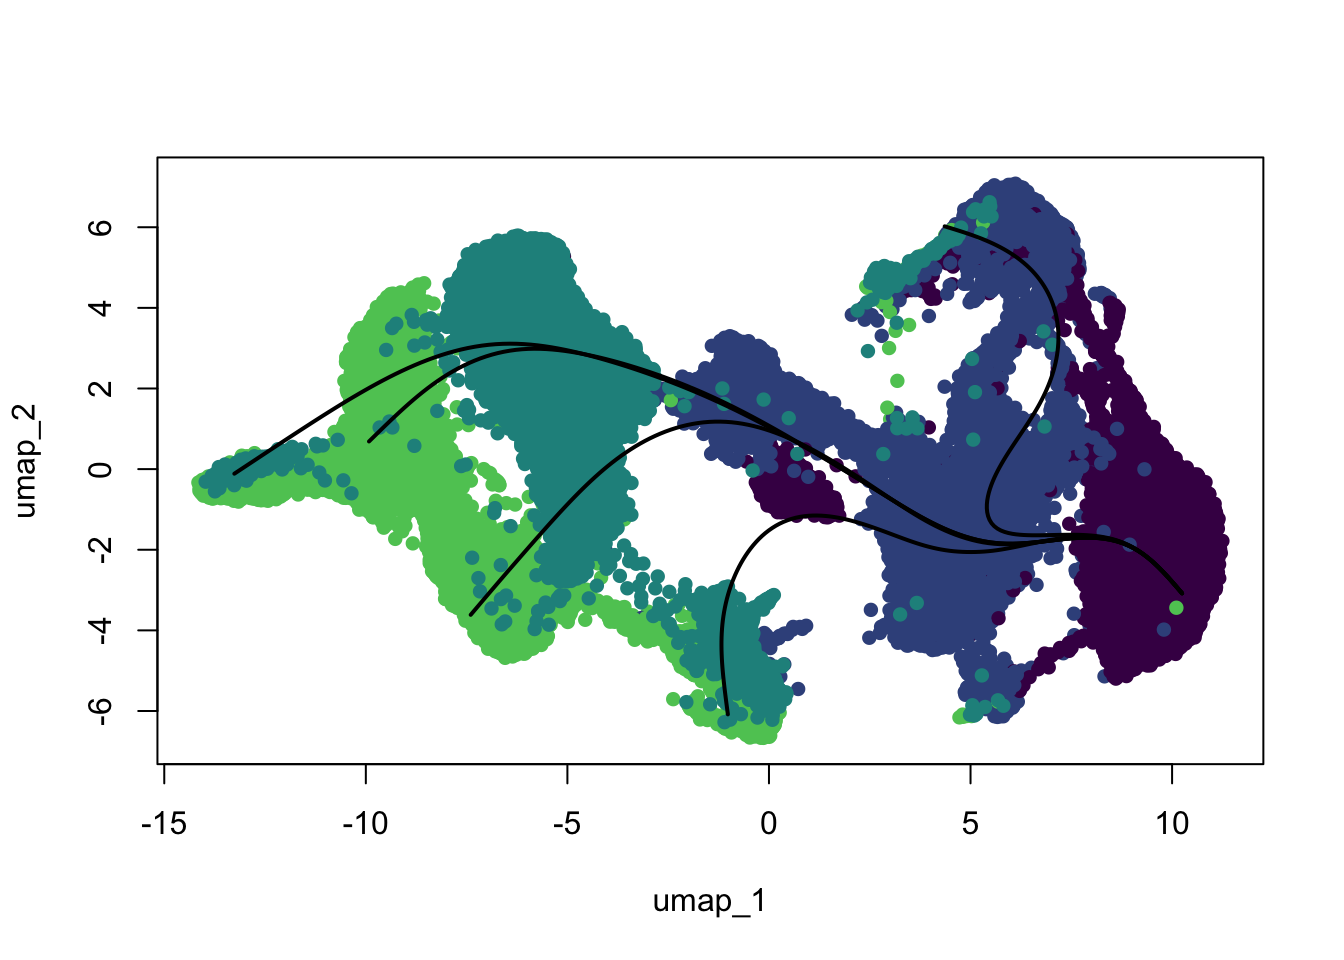
saveRDS(sce, file=paste0(basedir,"/data/LNmLToRev_EYFP_mLNf3_slingshot_v2_sce.rds"))summary(scemLNf3v2$slingPseudotime_1) Min. 1st Qu. Median Mean 3rd Qu. Max. NA's
0.000 2.715 10.207 10.639 17.741 25.951 9243 summary(scemLNf3v2$slingPseudotime_2) Min. 1st Qu. Median Mean 3rd Qu. Max. NA's
0.000 2.943 10.456 10.720 17.883 22.520 8873 summary(scemLNf3v2$slingPseudotime_3) Min. 1st Qu. Median Mean 3rd Qu. Max. NA's
0.000 1.959 6.353 8.476 15.403 20.789 12868 summary(scemLNf3v2$slingPseudotime_4) Min. 1st Qu. Median Mean 3rd Qu. Max. NA's
0.000 1.320 4.750 5.326 7.410 15.908 16994 summary(scemLNf3v2$slingPseudotime_5) Min. 1st Qu. Median Mean 3rd Qu. Max. NA's
0.000 1.315 5.106 5.355 8.250 14.665 17104 colors <- colorRampPalette(rev(brewer.pal(11,'Spectral')))(100)
plotcol <- colors[cut(slingAvgPseudotime(SlingshotDataSet(scemLNf3v2)), breaks=100)]
plot(reducedDims(scemLNf3v2)$UMAP, col = plotcol, pch=16, asp = 1)
lines(SlingshotDataSet(scemLNf3v2), lwd=2, col='black')
colors <- colorRampPalette(brewer.pal(11,'YlOrRd'))(100)
plotcol <- colors[cut(slingAvgPseudotime(SlingshotDataSet(scemLNf3v2)), breaks=100)]

plot(reducedDims(scemLNf3v2)$UMAP, col = plotcol, pch=16, asp = 1)
lines(SlingshotDataSet(scemLNf3v2), lwd=2, col='black')
colors <- colorRampPalette(brewer.pal(11,'YlGnBu'))(100)
plotcol <- colors[cut(slingAvgPseudotime(SlingshotDataSet(scemLNf3v2)), breaks=100)]

plot(reducedDims(scemLNf3v2)$UMAP, col = plotcol, pch=16, asp = 1)
lines(SlingshotDataSet(scemLNf3v2), lwd=2, col='black')
colors <- colorRampPalette(brewer.pal(11,'PuOr')[-6])(100)
plotcol <- colors[cut(slingAvgPseudotime(SlingshotDataSet(scemLNf3v2)), breaks=100)]

plot(reducedDims(scemLNf3v2)$UMAP, col = plotcol, pch=16, asp = 1)
lines(SlingshotDataSet(scemLNf3v2), lwd=2, col='black')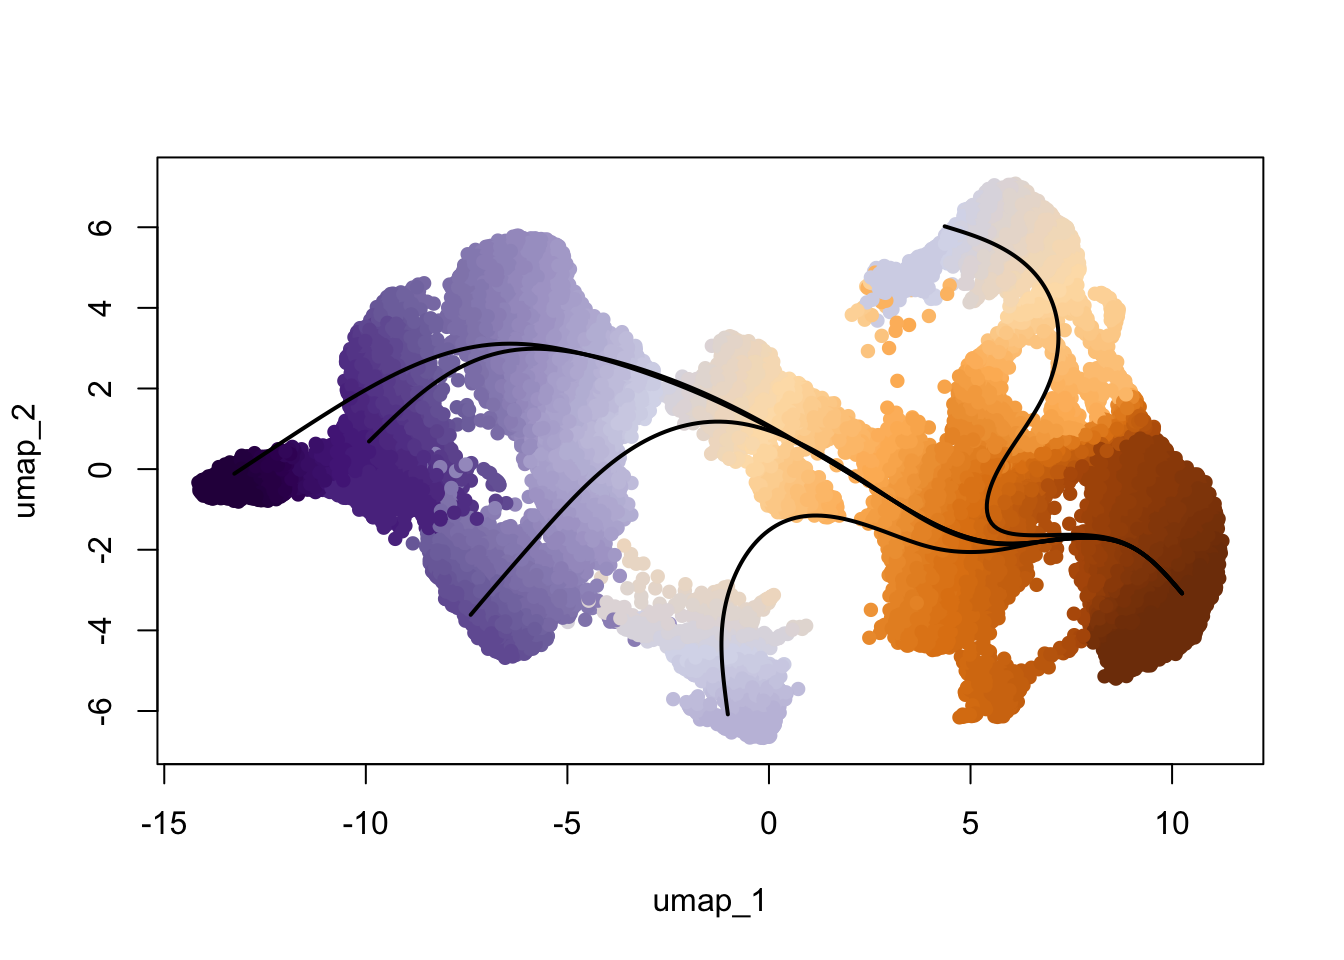
### color lineages
colLin <- c("#42a071","#900C3F","#424671","#e3953d","#b6856e")
names(colLin) <- c("1", "2", "3", "4", "5")

plot(reducedDims(scemLNf3v2)$UMAP, col = "#bfbcbd", pch=16, asp = 1)
lines(SlingshotDataSet(scemLNf3v2), lwd=4, col=colLin)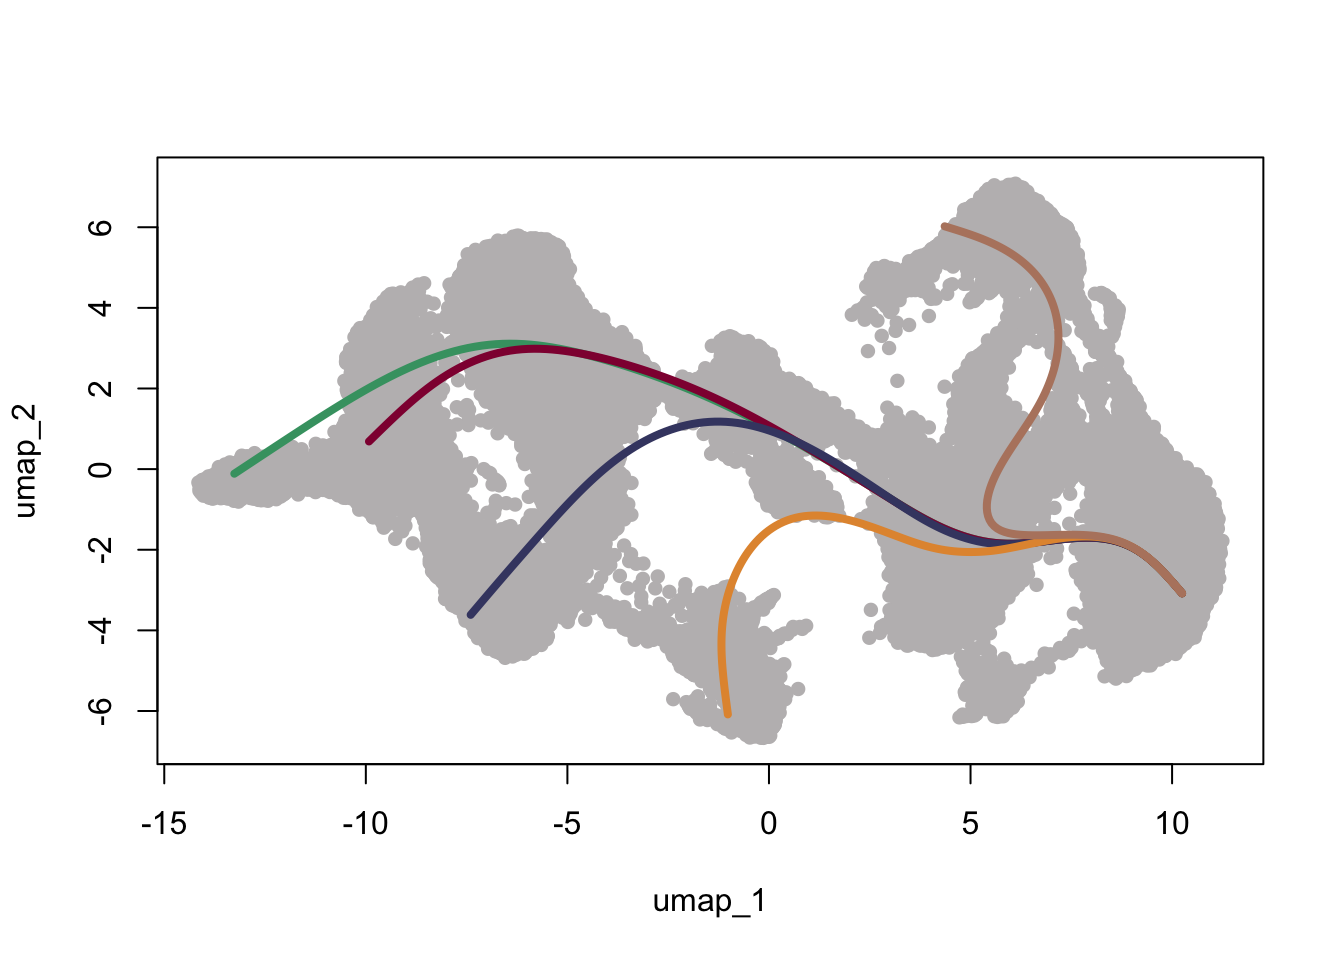
session info
date()[1] "Tue Jul 15 11:26:41 2025"sessionInfo()R version 4.4.0 (2024-04-24)
Platform: x86_64-apple-darwin20
Running under: macOS Ventura 13.7.6
Matrix products: default
BLAS: /Library/Frameworks/R.framework/Versions/4.4-x86_64/Resources/lib/libRblas.0.dylib
LAPACK: /Library/Frameworks/R.framework/Versions/4.4-x86_64/Resources/lib/libRlapack.dylib; LAPACK version 3.12.0
locale:
[1] en_US.UTF-8/en_US.UTF-8/en_US.UTF-8/C/en_US.UTF-8/en_US.UTF-8
time zone: Europe/Zurich
tzcode source: internal
attached base packages:
[1] grid stats4 stats graphics grDevices utils datasets methods base
other attached packages:
[1] here_1.0.1 RColorBrewer_1.1-3 slingshot_2.12.0
[4] TrajectoryUtils_1.12.0 princurve_2.1.6 NCmisc_1.2.0
[7] VennDiagram_1.7.3 futile.logger_1.4.3 ggupset_0.4.1
[10] gridExtra_2.3 DOSE_3.30.5 enrichplot_1.24.4
[13] msigdbr_24.1.0 org.Hs.eg.db_3.19.1 AnnotationDbi_1.66.0
[16] clusterProfiler_4.12.6 multtest_2.60.0 metap_1.12
[19] scater_1.32.1 scuttle_1.14.0 destiny_3.18.0
[22] circlize_0.4.16 muscat_1.18.0 viridis_0.6.5
[25] viridisLite_0.4.2 lubridate_1.9.4 forcats_1.0.0
[28] stringr_1.5.1 purrr_1.0.4 readr_2.1.5
[31] tidyr_1.3.1 tibble_3.2.1 tidyverse_2.0.0
[34] dplyr_1.1.4 SingleCellExperiment_1.26.0 SummarizedExperiment_1.34.0
[37] Biobase_2.64.0 GenomicRanges_1.56.2 GenomeInfoDb_1.40.1
[40] IRanges_2.38.1 S4Vectors_0.42.1 BiocGenerics_0.50.0
[43] MatrixGenerics_1.16.0 matrixStats_1.5.0 pheatmap_1.0.13
[46] ggpubr_0.6.0 ggplot2_3.5.2 Seurat_5.3.0
[49] SeuratObject_5.1.0 sp_2.2-0 runSeurat3_0.1.0
[52] ExploreSCdataSeurat3_0.1.0
loaded via a namespace (and not attached):
[1] igraph_2.1.4 ica_1.0-3 plotly_4.10.4
[4] Formula_1.2-5 zlibbioc_1.50.0 tidyselect_1.2.1
[7] bit_4.6.0 doParallel_1.0.17 clue_0.3-66
[10] lattice_0.22-7 rjson_0.2.23 blob_1.2.4
[13] S4Arrays_1.4.1 pbkrtest_0.5.4 parallel_4.4.0
[16] png_0.1-8 plotrix_3.8-4 cli_3.6.5
[19] ggplotify_0.1.2 goftest_1.2-3 VIM_6.2.2
[22] variancePartition_1.34.0 BiocNeighbors_1.22.0 shadowtext_0.1.4
[25] uwot_0.2.3 curl_6.2.3 tidytree_0.4.6
[28] mime_0.13 evaluate_1.0.3 ComplexHeatmap_2.20.0
[31] stringi_1.8.7 backports_1.5.0 lmerTest_3.1-3
[34] qqconf_1.3.2 httpuv_1.6.16 magrittr_2.0.3
[37] rappdirs_0.3.3 splines_4.4.0 ggraph_2.2.1
[40] sctransform_0.4.2 ggbeeswarm_0.7.2 DBI_1.2.3
[43] jquerylib_0.1.4 smoother_1.3 withr_3.0.2
[46] git2r_0.36.2 corpcor_1.6.10 reformulas_0.4.1
[49] class_7.3-23 rprojroot_2.0.4 lmtest_0.9-40
[52] tidygraph_1.3.1 formatR_1.14 colourpicker_1.3.0
[55] htmlwidgets_1.6.4 fs_1.6.6 ggrepel_0.9.6
[58] labeling_0.4.3 fANCOVA_0.6-1 SparseArray_1.4.8
[61] DESeq2_1.44.0 ranger_0.17.0 DEoptimR_1.1-3-1
[64] reticulate_1.42.0 hexbin_1.28.5 zoo_1.8-14
[67] XVector_0.44.0 knitr_1.50 ggplot.multistats_1.0.1
[70] UCSC.utils_1.0.0 RhpcBLASctl_0.23-42 timechange_0.3.0
[73] foreach_1.5.2 patchwork_1.3.0 caTools_1.18.3
[76] data.table_1.17.4 ggtree_3.12.0 R.oo_1.27.1
[79] RSpectra_0.16-2 irlba_2.3.5.1 fastDummies_1.7.5
[82] gridGraphics_0.5-1 lazyeval_0.2.2 yaml_2.3.10
[85] survival_3.8-3 scattermore_1.2 crayon_1.5.3
[88] RcppAnnoy_0.0.22 progressr_0.15.1 tweenr_2.0.3
[91] later_1.4.2 ggridges_0.5.6 codetools_0.2-20
[94] GlobalOptions_0.1.2 aod_1.3.3 KEGGREST_1.44.1
[97] Rtsne_0.17 shape_1.4.6.1 limma_3.60.6
[100] pkgconfig_2.0.3 TMB_1.9.17 spatstat.univar_3.1-3
[103] mathjaxr_1.8-0 EnvStats_3.1.0 aplot_0.2.5
[106] scatterplot3d_0.3-44 ape_5.8-1 spatstat.sparse_3.1-0
[109] xtable_1.8-4 car_3.1-3 plyr_1.8.9
[112] httr_1.4.7 rbibutils_2.3 tools_4.4.0
[115] globals_0.18.0 beeswarm_0.4.0 broom_1.0.8
[118] nlme_3.1-168 lambda.r_1.2.4 assertthat_0.2.1
[121] lme4_1.1-37 digest_0.6.37 numDeriv_2016.8-1.1
[124] Matrix_1.7-3 farver_2.1.2 tzdb_0.5.0
[127] remaCor_0.0.18 reshape2_1.4.4 yulab.utils_0.2.0
[130] glue_1.8.0 cachem_1.1.0 polyclip_1.10-7
[133] generics_0.1.4 Biostrings_2.72.1 mvtnorm_1.3-3
[136] parallelly_1.45.0 mnormt_2.1.1 statmod_1.5.0
[139] RcppHNSW_0.6.0 ScaledMatrix_1.12.0 carData_3.0-5
[142] minqa_1.2.8 pbapply_1.7-2 httr2_1.1.2
[145] spam_2.11-1 gson_0.1.0 graphlayouts_1.2.2
[148] gtools_3.9.5 ggsignif_0.6.4 RcppEigen_0.3.4.0.2
[151] shiny_1.10.0 GenomeInfoDbData_1.2.12 glmmTMB_1.1.11
[154] R.utils_2.13.0 memoise_2.0.1 rmarkdown_2.29
[157] scales_1.4.0 R.methodsS3_1.8.2 future_1.58.0
[160] RANN_2.6.2 Cairo_1.6-2 spatstat.data_3.1-6
[163] rstudioapi_0.17.1 cluster_2.1.8.1 mutoss_0.1-13
[166] spatstat.utils_3.1-4 hms_1.1.3 fitdistrplus_1.2-2
[169] cowplot_1.1.3 colorspace_2.1-1 rlang_1.1.6
[172] DelayedMatrixStats_1.26.0 sparseMatrixStats_1.16.0 xts_0.14.1
[175] dotCall64_1.2 shinydashboard_0.7.3 ggforce_0.4.2
[178] laeken_0.5.3 mgcv_1.9-3 xfun_0.52
[181] e1071_1.7-16 TH.data_1.1-3 iterators_1.0.14
[184] abind_1.4-8 GOSemSim_2.30.2 treeio_1.28.0
[187] futile.options_1.0.1 bitops_1.0-9 Rdpack_2.6.4
[190] promises_1.3.3 scatterpie_0.2.4 RSQLite_2.4.0
[193] qvalue_2.36.0 sandwich_3.1-1 fgsea_1.30.0
[196] DelayedArray_0.30.1 proxy_0.4-27 GO.db_3.19.1
[199] compiler_4.4.0 prettyunits_1.2.0 boot_1.3-31
[202] beachmat_2.20.0 listenv_0.9.1 Rcpp_1.0.14
[205] edgeR_4.2.2 workflowr_1.7.1 BiocSingular_1.20.0
[208] tensor_1.5 MASS_7.3-65 progress_1.2.3
[211] BiocParallel_1.38.0 babelgene_22.9 spatstat.random_3.4-1
[214] R6_2.6.1 fastmap_1.2.0 multcomp_1.4-28
[217] fastmatch_1.1-6 rstatix_0.7.2 vipor_0.4.7
[220] TTR_0.24.4 ROCR_1.0-11 TFisher_0.2.0
[223] rsvd_1.0.5 vcd_1.4-13 nnet_7.3-20
[226] gtable_0.3.6 KernSmooth_2.23-26 miniUI_0.1.2
[229] deldir_2.0-4 htmltools_0.5.8.1 ggthemes_5.1.0
[232] bit64_4.6.0-1 spatstat.explore_3.4-3 lifecycle_1.0.4
[235] blme_1.0-6 nloptr_2.2.1 sass_0.4.10
[238] vctrs_0.6.5 robustbase_0.99-4-1 spatstat.geom_3.4-1
[241] sn_2.1.1 ggfun_0.1.8 future.apply_1.11.3
[244] bslib_0.9.0 pillar_1.10.2 gplots_3.2.0
[247] pcaMethods_1.96.0 locfit_1.5-9.12 jsonlite_2.0.0
[250] GetoptLong_1.0.5
sessionInfo()R version 4.4.0 (2024-04-24)
Platform: x86_64-apple-darwin20
Running under: macOS Ventura 13.7.6
Matrix products: default
BLAS: /Library/Frameworks/R.framework/Versions/4.4-x86_64/Resources/lib/libRblas.0.dylib
LAPACK: /Library/Frameworks/R.framework/Versions/4.4-x86_64/Resources/lib/libRlapack.dylib; LAPACK version 3.12.0
locale:
[1] en_US.UTF-8/en_US.UTF-8/en_US.UTF-8/C/en_US.UTF-8/en_US.UTF-8
time zone: Europe/Zurich
tzcode source: internal
attached base packages:
[1] grid stats4 stats graphics grDevices utils datasets methods base
other attached packages:
[1] here_1.0.1 RColorBrewer_1.1-3 slingshot_2.12.0
[4] TrajectoryUtils_1.12.0 princurve_2.1.6 NCmisc_1.2.0
[7] VennDiagram_1.7.3 futile.logger_1.4.3 ggupset_0.4.1
[10] gridExtra_2.3 DOSE_3.30.5 enrichplot_1.24.4
[13] msigdbr_24.1.0 org.Hs.eg.db_3.19.1 AnnotationDbi_1.66.0
[16] clusterProfiler_4.12.6 multtest_2.60.0 metap_1.12
[19] scater_1.32.1 scuttle_1.14.0 destiny_3.18.0
[22] circlize_0.4.16 muscat_1.18.0 viridis_0.6.5
[25] viridisLite_0.4.2 lubridate_1.9.4 forcats_1.0.0
[28] stringr_1.5.1 purrr_1.0.4 readr_2.1.5
[31] tidyr_1.3.1 tibble_3.2.1 tidyverse_2.0.0
[34] dplyr_1.1.4 SingleCellExperiment_1.26.0 SummarizedExperiment_1.34.0
[37] Biobase_2.64.0 GenomicRanges_1.56.2 GenomeInfoDb_1.40.1
[40] IRanges_2.38.1 S4Vectors_0.42.1 BiocGenerics_0.50.0
[43] MatrixGenerics_1.16.0 matrixStats_1.5.0 pheatmap_1.0.13
[46] ggpubr_0.6.0 ggplot2_3.5.2 Seurat_5.3.0
[49] SeuratObject_5.1.0 sp_2.2-0 runSeurat3_0.1.0
[52] ExploreSCdataSeurat3_0.1.0
loaded via a namespace (and not attached):
[1] igraph_2.1.4 ica_1.0-3 plotly_4.10.4
[4] Formula_1.2-5 zlibbioc_1.50.0 tidyselect_1.2.1
[7] bit_4.6.0 doParallel_1.0.17 clue_0.3-66
[10] lattice_0.22-7 rjson_0.2.23 blob_1.2.4
[13] S4Arrays_1.4.1 pbkrtest_0.5.4 parallel_4.4.0
[16] png_0.1-8 plotrix_3.8-4 cli_3.6.5
[19] ggplotify_0.1.2 goftest_1.2-3 VIM_6.2.2
[22] variancePartition_1.34.0 BiocNeighbors_1.22.0 shadowtext_0.1.4
[25] uwot_0.2.3 curl_6.2.3 tidytree_0.4.6
[28] mime_0.13 evaluate_1.0.3 ComplexHeatmap_2.20.0
[31] stringi_1.8.7 backports_1.5.0 lmerTest_3.1-3
[34] qqconf_1.3.2 httpuv_1.6.16 magrittr_2.0.3
[37] rappdirs_0.3.3 splines_4.4.0 ggraph_2.2.1
[40] sctransform_0.4.2 ggbeeswarm_0.7.2 DBI_1.2.3
[43] jquerylib_0.1.4 smoother_1.3 withr_3.0.2
[46] git2r_0.36.2 corpcor_1.6.10 reformulas_0.4.1
[49] class_7.3-23 rprojroot_2.0.4 lmtest_0.9-40
[52] tidygraph_1.3.1 formatR_1.14 colourpicker_1.3.0
[55] htmlwidgets_1.6.4 fs_1.6.6 ggrepel_0.9.6
[58] labeling_0.4.3 fANCOVA_0.6-1 SparseArray_1.4.8
[61] DESeq2_1.44.0 ranger_0.17.0 DEoptimR_1.1-3-1
[64] reticulate_1.42.0 hexbin_1.28.5 zoo_1.8-14
[67] XVector_0.44.0 knitr_1.50 ggplot.multistats_1.0.1
[70] UCSC.utils_1.0.0 RhpcBLASctl_0.23-42 timechange_0.3.0
[73] foreach_1.5.2 patchwork_1.3.0 caTools_1.18.3
[76] data.table_1.17.4 ggtree_3.12.0 R.oo_1.27.1
[79] RSpectra_0.16-2 irlba_2.3.5.1 fastDummies_1.7.5
[82] gridGraphics_0.5-1 lazyeval_0.2.2 yaml_2.3.10
[85] survival_3.8-3 scattermore_1.2 crayon_1.5.3
[88] RcppAnnoy_0.0.22 progressr_0.15.1 tweenr_2.0.3
[91] later_1.4.2 ggridges_0.5.6 codetools_0.2-20
[94] GlobalOptions_0.1.2 aod_1.3.3 KEGGREST_1.44.1
[97] Rtsne_0.17 shape_1.4.6.1 limma_3.60.6
[100] pkgconfig_2.0.3 TMB_1.9.17 spatstat.univar_3.1-3
[103] mathjaxr_1.8-0 EnvStats_3.1.0 aplot_0.2.5
[106] scatterplot3d_0.3-44 ape_5.8-1 spatstat.sparse_3.1-0
[109] xtable_1.8-4 car_3.1-3 plyr_1.8.9
[112] httr_1.4.7 rbibutils_2.3 tools_4.4.0
[115] globals_0.18.0 beeswarm_0.4.0 broom_1.0.8
[118] nlme_3.1-168 lambda.r_1.2.4 assertthat_0.2.1
[121] lme4_1.1-37 digest_0.6.37 numDeriv_2016.8-1.1
[124] Matrix_1.7-3 farver_2.1.2 tzdb_0.5.0
[127] remaCor_0.0.18 reshape2_1.4.4 yulab.utils_0.2.0
[130] glue_1.8.0 cachem_1.1.0 polyclip_1.10-7
[133] generics_0.1.4 Biostrings_2.72.1 mvtnorm_1.3-3
[136] parallelly_1.45.0 mnormt_2.1.1 statmod_1.5.0
[139] RcppHNSW_0.6.0 ScaledMatrix_1.12.0 carData_3.0-5
[142] minqa_1.2.8 pbapply_1.7-2 httr2_1.1.2
[145] spam_2.11-1 gson_0.1.0 graphlayouts_1.2.2
[148] gtools_3.9.5 ggsignif_0.6.4 RcppEigen_0.3.4.0.2
[151] shiny_1.10.0 GenomeInfoDbData_1.2.12 glmmTMB_1.1.11
[154] R.utils_2.13.0 memoise_2.0.1 rmarkdown_2.29
[157] scales_1.4.0 R.methodsS3_1.8.2 future_1.58.0
[160] RANN_2.6.2 Cairo_1.6-2 spatstat.data_3.1-6
[163] rstudioapi_0.17.1 cluster_2.1.8.1 mutoss_0.1-13
[166] spatstat.utils_3.1-4 hms_1.1.3 fitdistrplus_1.2-2
[169] cowplot_1.1.3 colorspace_2.1-1 rlang_1.1.6
[172] DelayedMatrixStats_1.26.0 sparseMatrixStats_1.16.0 xts_0.14.1
[175] dotCall64_1.2 shinydashboard_0.7.3 ggforce_0.4.2
[178] laeken_0.5.3 mgcv_1.9-3 xfun_0.52
[181] e1071_1.7-16 TH.data_1.1-3 iterators_1.0.14
[184] abind_1.4-8 GOSemSim_2.30.2 treeio_1.28.0
[187] futile.options_1.0.1 bitops_1.0-9 Rdpack_2.6.4
[190] promises_1.3.3 scatterpie_0.2.4 RSQLite_2.4.0
[193] qvalue_2.36.0 sandwich_3.1-1 fgsea_1.30.0
[196] DelayedArray_0.30.1 proxy_0.4-27 GO.db_3.19.1
[199] compiler_4.4.0 prettyunits_1.2.0 boot_1.3-31
[202] beachmat_2.20.0 listenv_0.9.1 Rcpp_1.0.14
[205] edgeR_4.2.2 workflowr_1.7.1 BiocSingular_1.20.0
[208] tensor_1.5 MASS_7.3-65 progress_1.2.3
[211] BiocParallel_1.38.0 babelgene_22.9 spatstat.random_3.4-1
[214] R6_2.6.1 fastmap_1.2.0 multcomp_1.4-28
[217] fastmatch_1.1-6 rstatix_0.7.2 vipor_0.4.7
[220] TTR_0.24.4 ROCR_1.0-11 TFisher_0.2.0
[223] rsvd_1.0.5 vcd_1.4-13 nnet_7.3-20
[226] gtable_0.3.6 KernSmooth_2.23-26 miniUI_0.1.2
[229] deldir_2.0-4 htmltools_0.5.8.1 ggthemes_5.1.0
[232] bit64_4.6.0-1 spatstat.explore_3.4-3 lifecycle_1.0.4
[235] blme_1.0-6 nloptr_2.2.1 sass_0.4.10
[238] vctrs_0.6.5 robustbase_0.99-4-1 spatstat.geom_3.4-1
[241] sn_2.1.1 ggfun_0.1.8 future.apply_1.11.3
[244] bslib_0.9.0 pillar_1.10.2 gplots_3.2.0
[247] pcaMethods_1.96.0 locfit_1.5-9.12 jsonlite_2.0.0
[250] GetoptLong_1.0.5