characterize adult mLN and iLN
A.DeMartin
2025-05-06
Last updated: 2025-07-14
Checks: 6 1
Knit directory: LNdevMouse24.2/
This reproducible R Markdown analysis was created with workflowr (version 1.7.1). The Checks tab describes the reproducibility checks that were applied when the results were created. The Past versions tab lists the development history.
The R Markdown file has unstaged changes. To know which version of
the R Markdown file created these results, you’ll want to first commit
it to the Git repo. If you’re still working on the analysis, you can
ignore this warning. When you’re finished, you can run
wflow_publish to commit the R Markdown file and build the
HTML.
Great job! The global environment was empty. Objects defined in the global environment can affect the analysis in your R Markdown file in unknown ways. For reproduciblity it’s best to always run the code in an empty environment.
The command set.seed(20250625) was run prior to running
the code in the R Markdown file. Setting a seed ensures that any results
that rely on randomness, e.g. subsampling or permutations, are
reproducible.
Great job! Recording the operating system, R version, and package versions is critical for reproducibility.
Nice! There were no cached chunks for this analysis, so you can be confident that you successfully produced the results during this run.
Great job! Using relative paths to the files within your workflowr project makes it easier to run your code on other machines.
Great! You are using Git for version control. Tracking code development and connecting the code version to the results is critical for reproducibility.
The results in this page were generated with repository version 89c3497. See the Past versions tab to see a history of the changes made to the R Markdown and HTML files.
Note that you need to be careful to ensure that all relevant files for
the analysis have been committed to Git prior to generating the results
(you can use wflow_publish or
wflow_git_commit). workflowr only checks the R Markdown
file, but you know if there are other scripts or data files that it
depends on. Below is the status of the Git repository when the results
were generated:
Ignored files:
    Ignored:    .DS_Store
    Ignored:    .Rhistory
    Ignored:    .Rproj.user/
    Ignored:    analysis/.DS_Store

Unstaged changes:
    Modified:   analysis/adult_mLN_iLN.Rmd
    Modified:   analysis/adult_mLN_iLN2.Rmd
    Modified:   analysis/index.Rmd
Note that any generated files, e.g. HTML, png, CSS, etc., are not included in this status report because it is ok for generated content to have uncommitted changes.
These are the previous versions of the repository in which changes were
made to the R Markdown (analysis/adult_mLN_iLN2.Rmd) and
HTML (docs/adult_mLN_iLN2.html) files. If you’ve configured
a remote Git repository (see ?wflow_git_remote), click on
the hyperlinks in the table below to view the files as they were in that
past version.
| File | Version | Author | Date | Message |
|---|---|---|---|---|
| Rmd | 0ff885c | angeldemartin | 2025-07-11 | july11 |
load packages
library(ExploreSCdataSeurat3)
library(runSeurat3)
library(Seurat)
library(ggpubr)
library(pheatmap)
library(SingleCellExperiment)
library(dplyr)
library(tidyverse)
library(viridis)
library(muscat)
library(circlize)
library(destiny)
library(scater)
library(metap)
library(multtest)
library(clusterProfiler)
library(org.Hs.eg.db)
library(msigdbr)
library(enrichplot)
library(DOSE)
library(grid)
library(gridExtra)
library(ggupset)
library(VennDiagram)
library(NCmisc)
library(here)
load int object adult
basedir <- here()
fileNam <- paste0(basedir, "/data/LNmLToRev_adultonly_seurat.integrated.rds")
seuratA.int <- readRDS(fileNam)
set color vectors
colLab <- c("#42a071", "#900C3F","#b66e8d", "#61a4ba", "#424671", "#003C67FF",
            "#e3953d", "#714542", "#b6856e")

names(colLab) <- c("FDC/MRC", "TRC", "TBRC", "MedRC/IFRC", "MedRC" , "actMedRC",
                   "PRC", "Pi16+RC", "VSMC")

coltimepoint <- c("#440154FF", "#3B528BFF", "#21908CFF", "#5DC863FF")
names(coltimepoint) <- c("E18", "P7", "3w", "8w")

collocation <- c("#61baba", "#ba6161")
names(collocation) <- c("iLN", "mLN")

colLoc <- c("#61baba", "#ba6161")
names(colLoc) <- unique(seuratA.int$location)
umap label
DimPlot(seuratA.int, reduction = "umap", group.by = "label", cols = colLab)+
  theme_bw() +
  theme(axis.text = element_blank(), axis.ticks = element_blank(),
        panel.grid.minor = element_blank()) +
  xlab("UMAP1") +
  ylab("UMAP2")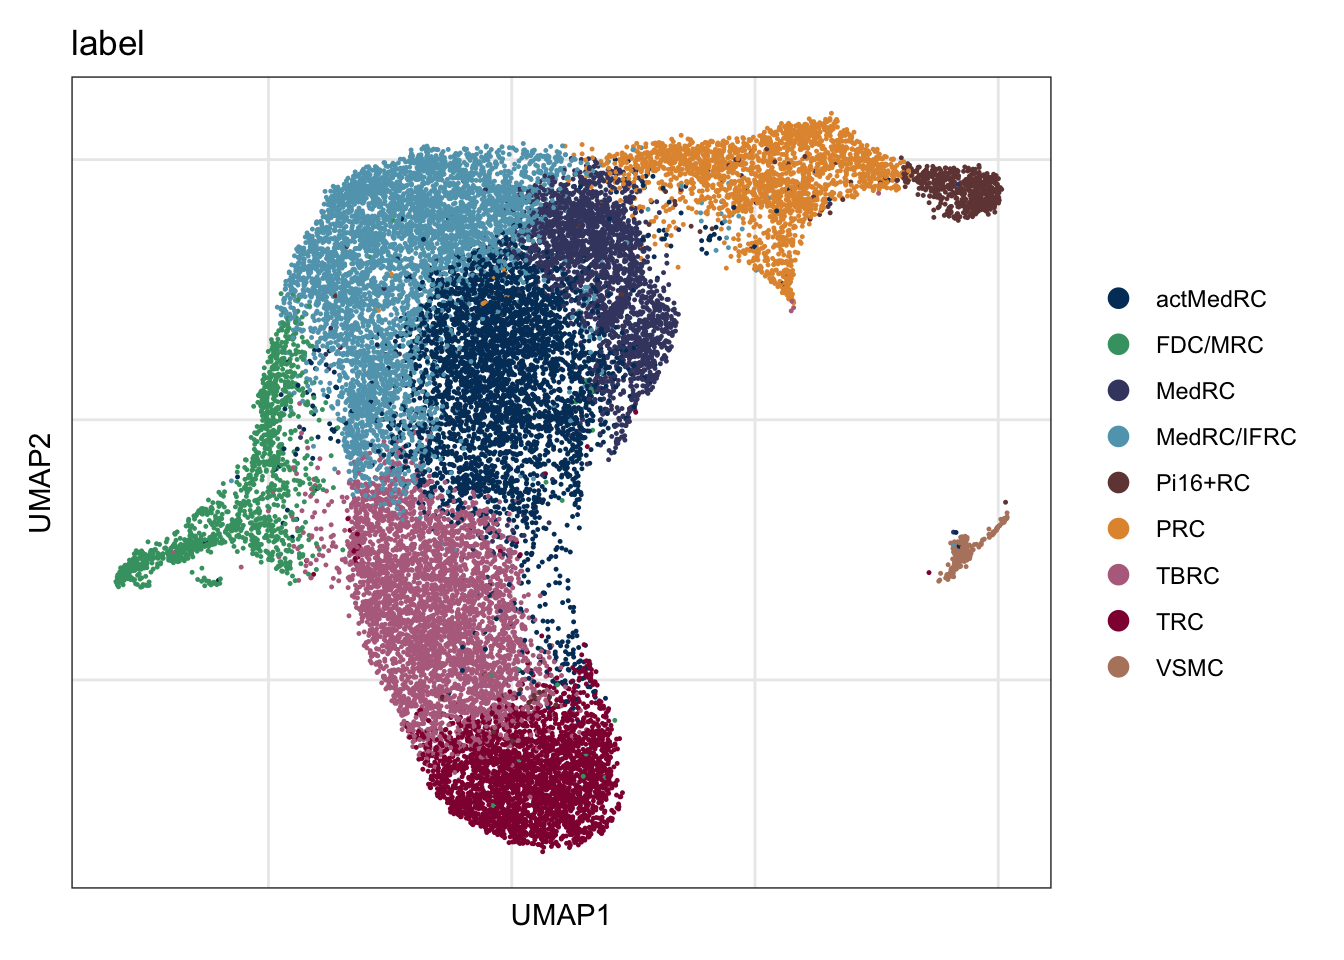
counts
knitr::kable(table(seuratA.int$label, seuratA.int$location))| iLN | mLN | |
|---|---|---|
| actMedRC | 2592 | 1428 |
| FDC/MRC | 449 | 843 |
| MedRC | 1960 | 411 |
| MedRC/IFRC | 2660 | 2208 |
| Pi16+RC | 46 | 554 |
| PRC | 849 | 1343 |
| TBRC | 2042 | 1799 |
| TRC | 1611 | 1228 |
| VSMC | 138 | 127 |
knitr::kable(table(seuratA.int$location))| Var1 | Freq |
|---|---|
| iLN | 12347 |
| mLN | 9941 |
seuratSub <- subset(seuratA.int, Rosa26eyfp.Rosa26eyfp>0)
eyfpPos <- colnames(seuratSub)

seuratA.int$EYFP <-"neg"
seuratA.int$EYFP[which(colnames(seuratA.int)%in%eyfpPos)] <- "pos"
table(seuratA.int$dataset, seuratA.int$EYFP)
                                                     neg  pos
  380131_11-11_20250305_Mu_Cxcl13EYFP_Adult_pLN_FRC 1875 3378
  380131_12-12_20250305_Mu_Cxcl13EYFP_Adult_mLN_FRC 2634 3785
  382581_08-8_20250320_Mu_Cxcl13EYFP_Adult_pLN_FRC  2970 4124
  382581_09-9_20250320_Mu_Cxcl13EYFP_Adult_mLN_FRC   848 2674
knitr::kable(table( seuratA.int$label, seuratA.int$EYFP))| neg | pos | |
|---|---|---|
| actMedRC | 1410 | 2610 |
| FDC/MRC | 301 | 991 |
| MedRC | 828 | 1543 |
| MedRC/IFRC | 2051 | 2817 |
| Pi16+RC | 329 | 271 |
| PRC | 1181 | 1011 |
| TBRC | 1280 | 2561 |
| TRC | 774 | 2065 |
| VSMC | 173 | 92 |
## relative abundance per location
clustCond <- data.frame(table(seuratA.int$location, seuratA.int$label))
colnames(clustCond) <- c("location", "intCluster", "cnt")
condTot <- data.frame(table(seuratA.int$location))
colnames(condTot) <- c("location", "tot")
colPaldat <- data.frame(col=colLab) %>%
  rownames_to_column(var = "intCluster")
clustDat2 <- clustCond %>%  left_join(., condTot, by = "location") %>%
  mutate(relAb = cnt/tot * 100) %>%
  left_join(., colPaldat, by = "intCluster")

knitr::kable(clustDat2)| location | intCluster | cnt | tot | relAb | col |
|---|---|---|---|---|---|
| iLN | actMedRC | 2592 | 12347 | 20.9929538 | #003C67FF |
| mLN | actMedRC | 1428 | 9941 | 14.3647520 | #003C67FF |
| iLN | FDC/MRC | 449 | 12347 | 3.6365109 | #42a071 |
| mLN | FDC/MRC | 843 | 9941 | 8.4800322 | #42a071 |
| iLN | MedRC | 1960 | 12347 | 15.8743014 | #424671 |
| mLN | MedRC | 411 | 9941 | 4.1343929 | #424671 |
| iLN | MedRC/IFRC | 2660 | 12347 | 21.5436948 | #61a4ba |
| mLN | MedRC/IFRC | 2208 | 9941 | 22.2110452 | #61a4ba |
| iLN | Pi16+RC | 46 | 12347 | 0.3725601 | #714542 |
| mLN | Pi16+RC | 554 | 9941 | 5.5728800 | #714542 |
| iLN | PRC | 849 | 12347 | 6.8761643 | #e3953d |
| mLN | PRC | 1343 | 9941 | 13.5097073 | #e3953d |
| iLN | TBRC | 2042 | 12347 | 16.5384304 | #b66e8d |
| mLN | TBRC | 1799 | 9941 | 18.0967709 | #b66e8d |
| iLN | TRC | 1611 | 12347 | 13.0477039 | #900C3F |
| mLN | TRC | 1228 | 9941 | 12.3528820 | #900C3F |
| iLN | VSMC | 138 | 12347 | 1.1176804 | #b6856e |
| mLN | VSMC | 127 | 9941 | 1.2775375 | #b6856e |
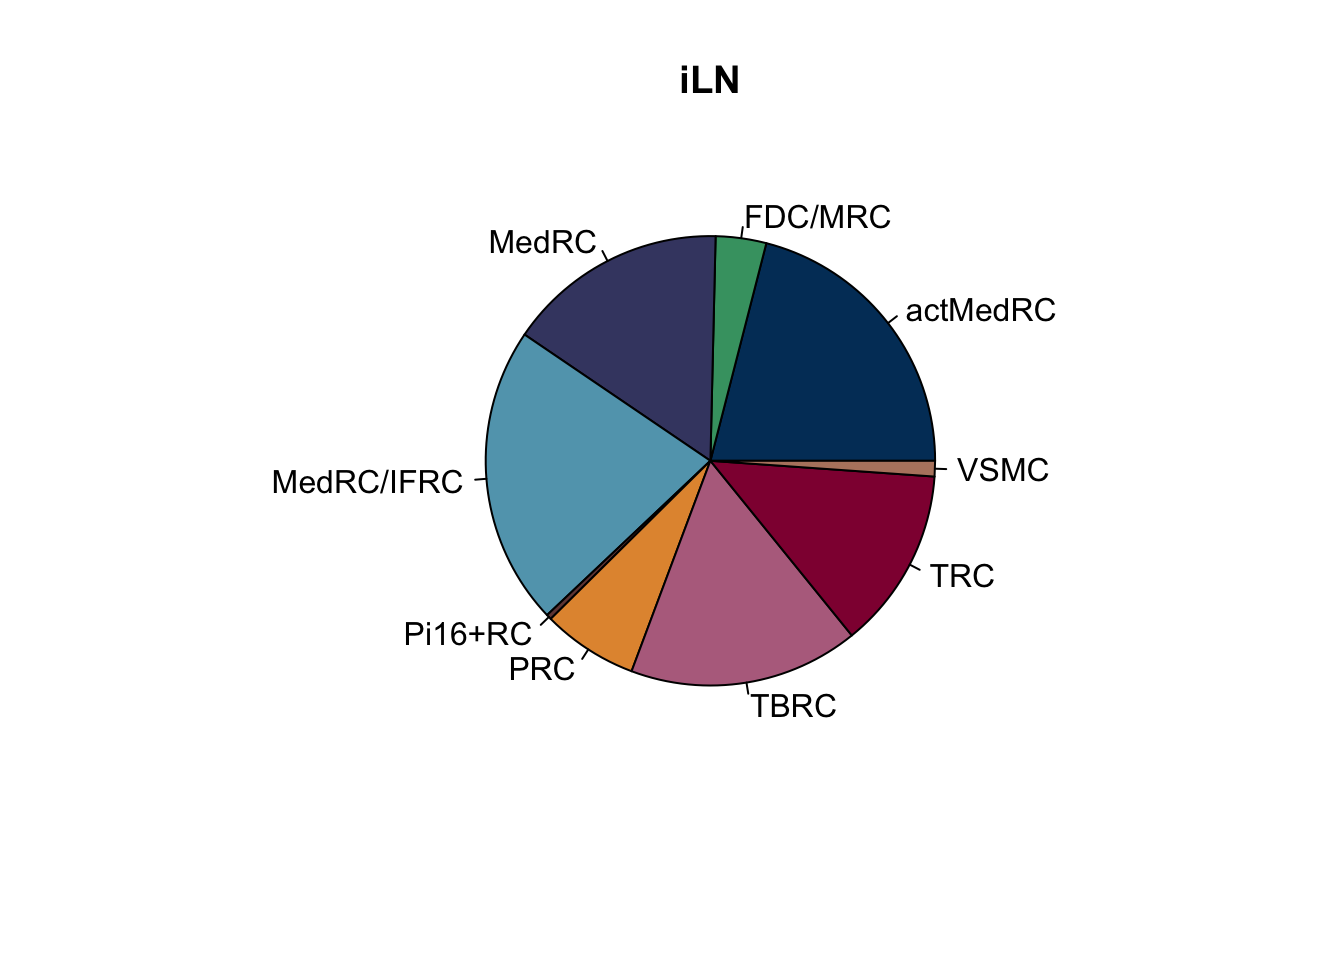
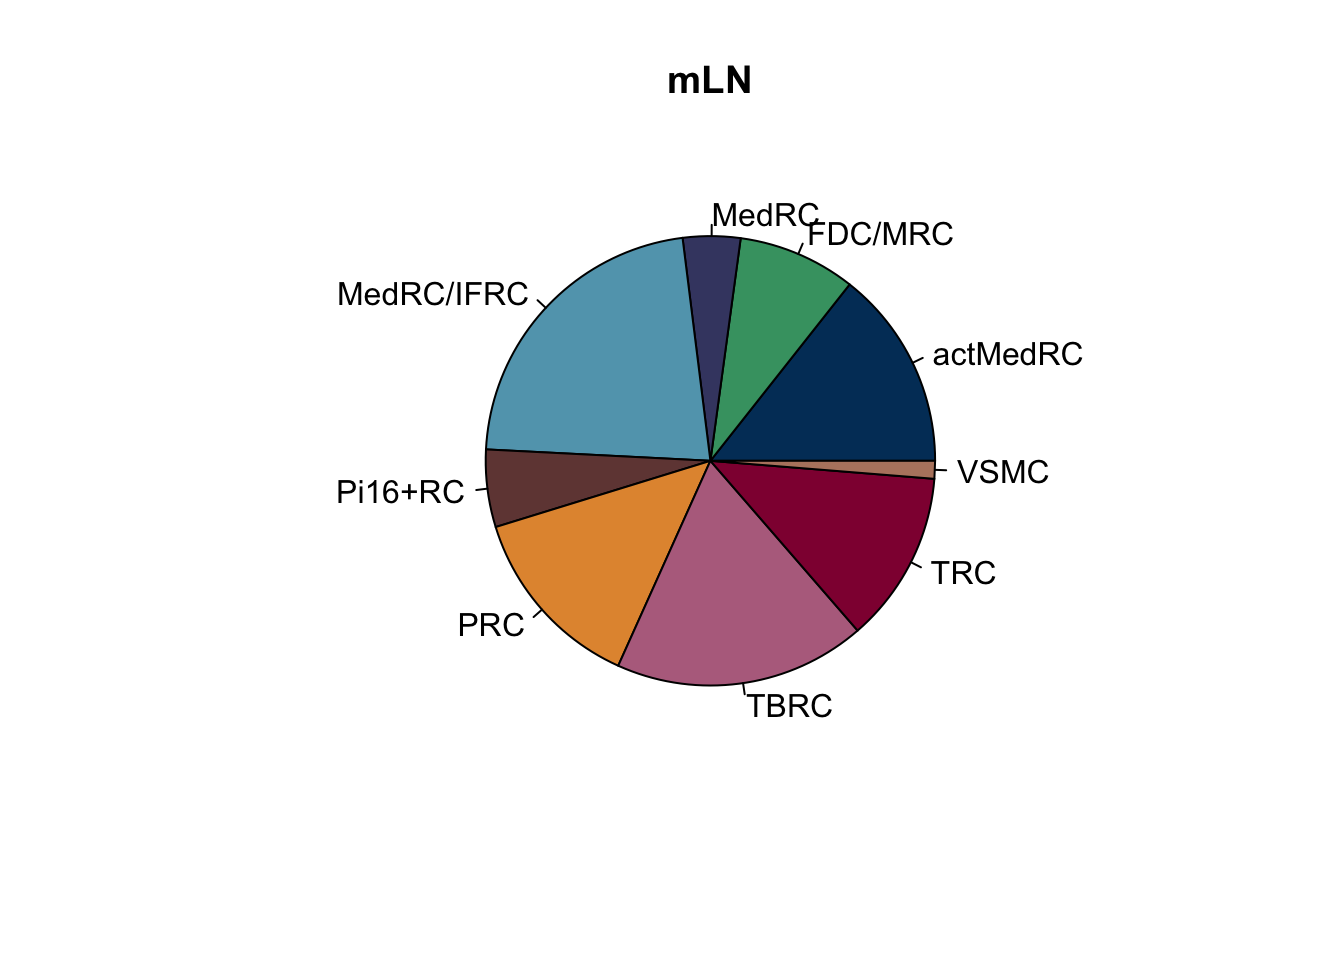
relative subset abundance
lapply(names(colLoc), function(co){
  clustDat2sel <- clustDat2 %>% filter(location==co)
  pie(clustDat2sel$relAb,
      labels = clustDat2sel$intCluster,
      col = clustDat2sel$col,
      main = paste0(co))
})
[[1]]
NULL

[[2]]
NULL
fraction EYFP+
across all
## across all
eyfpCnt <- data.frame(table(seuratA.int$label, seuratA.int$EYFP)) %>%
  spread(.,Var2 , Freq) %>% mutate(tot=pos+neg) %>%
  mutate(freqPos=pos*100/tot) %>% mutate(freqNeg=neg*100/tot)

eyfpCntDat <- eyfpCnt %>% dplyr::select(Var1, freqPos, freqNeg) %>%
  gather(., eyfp, freq, freqPos:freqNeg)

p <- ggpubr::ggbarplot(eyfpCntDat, x="Var1", y="freq", fill="eyfp",
                  palette = c("#9d9f9e","#09983f"),
                  order = rev(names(colLab)),
                  xlab = "", ylab = "Frequency",
                  orientation = "horizontal") +
  theme(legend.position = "right")
p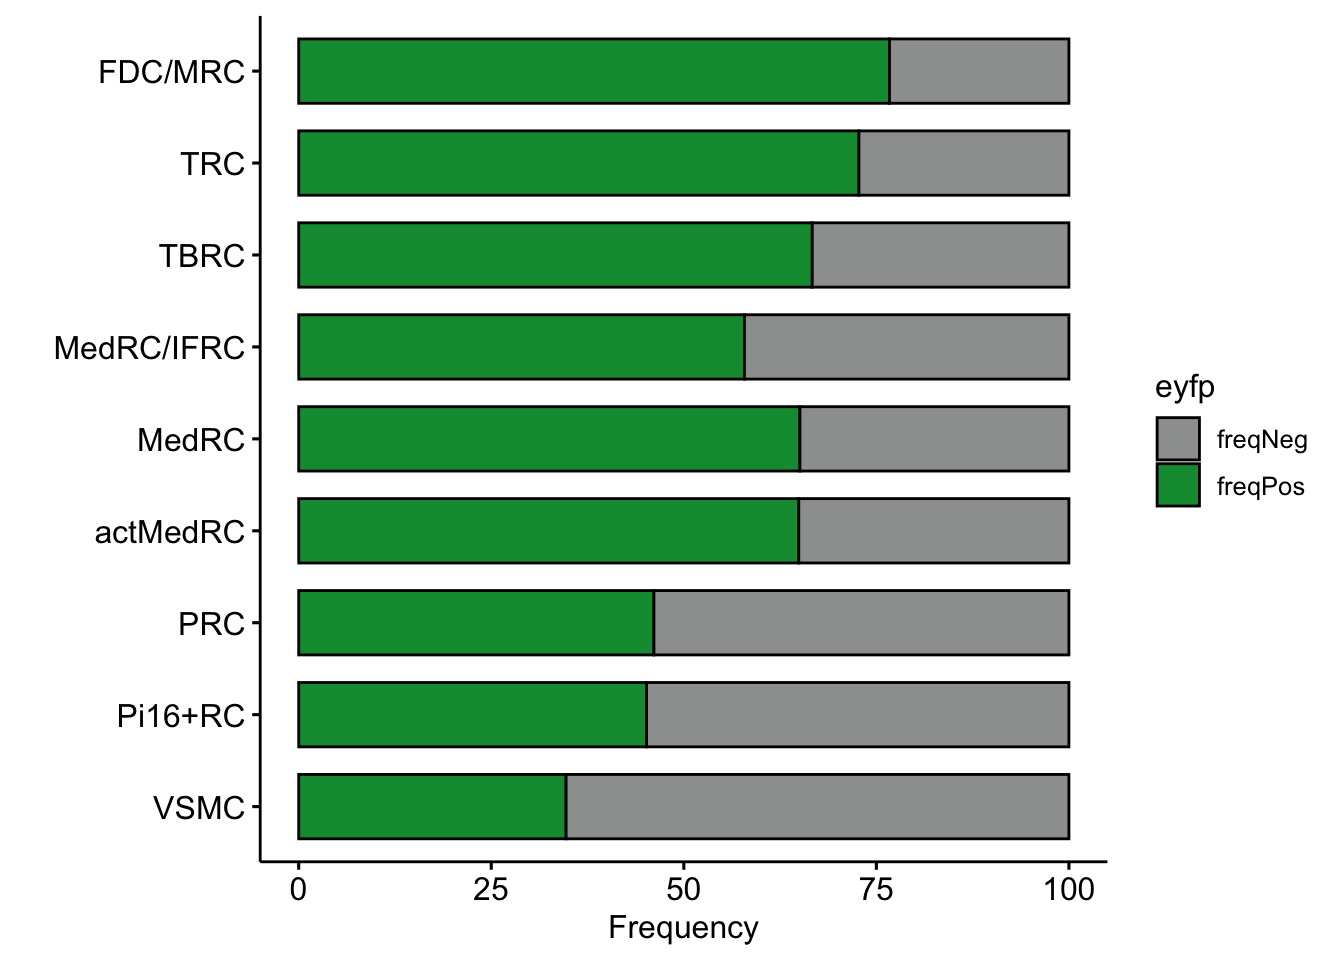
individual LNs
LNvec <- unique(seuratA.int$location)

lapply(LNvec, function(ln){
  seuratSub <- subset(seuratA.int, location== ln)
  eyfpCnt <- data.frame(table(seuratSub$label, seuratSub$EYFP)) %>%
  spread(.,Var2 , Freq) %>% mutate(tot=pos+neg) %>%
  mutate(freqPos=pos*100/tot) %>% mutate(freqNeg=neg*100/tot)

  eyfpCntDat <- eyfpCnt %>% dplyr::select(Var1, freqPos, freqNeg) %>%
    gather(., eyfp, freq, freqPos:freqNeg)

  p <- ggpubr::ggbarplot(eyfpCntDat, x="Var1", y="freq", fill="eyfp",
                  palette = c("#9d9f9e","#09983f"),
                  order = rev(names(colLab)),
                  xlab = "", ylab = "Frequency",
                  orientation = "horizontal") +
    theme(legend.position = "right") +
    ggtitle(paste0("Fraction EYFP+ cells - ", ln))
  p

})
[[1]]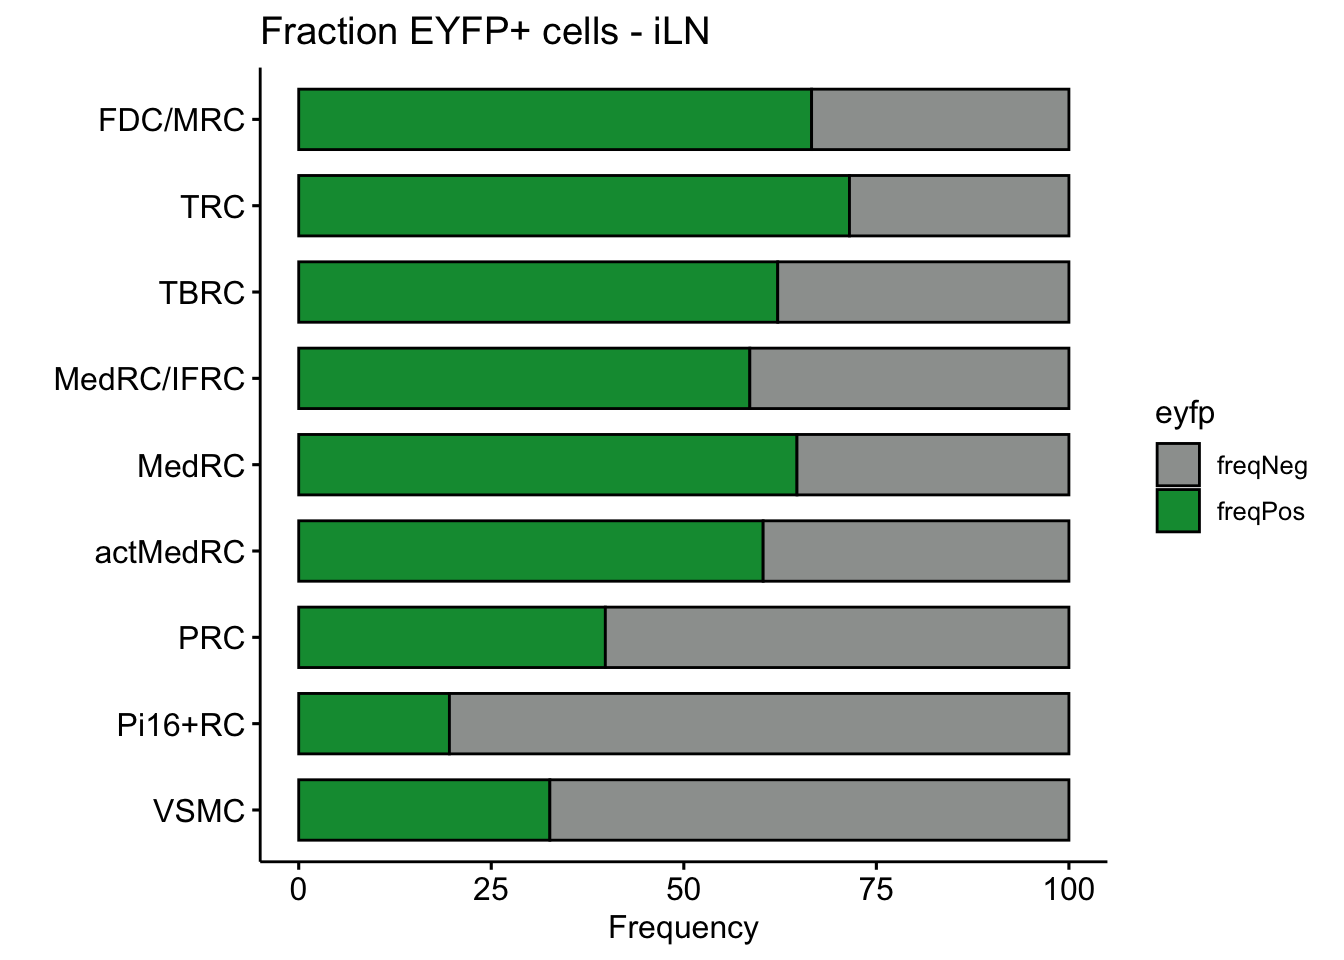
[[2]]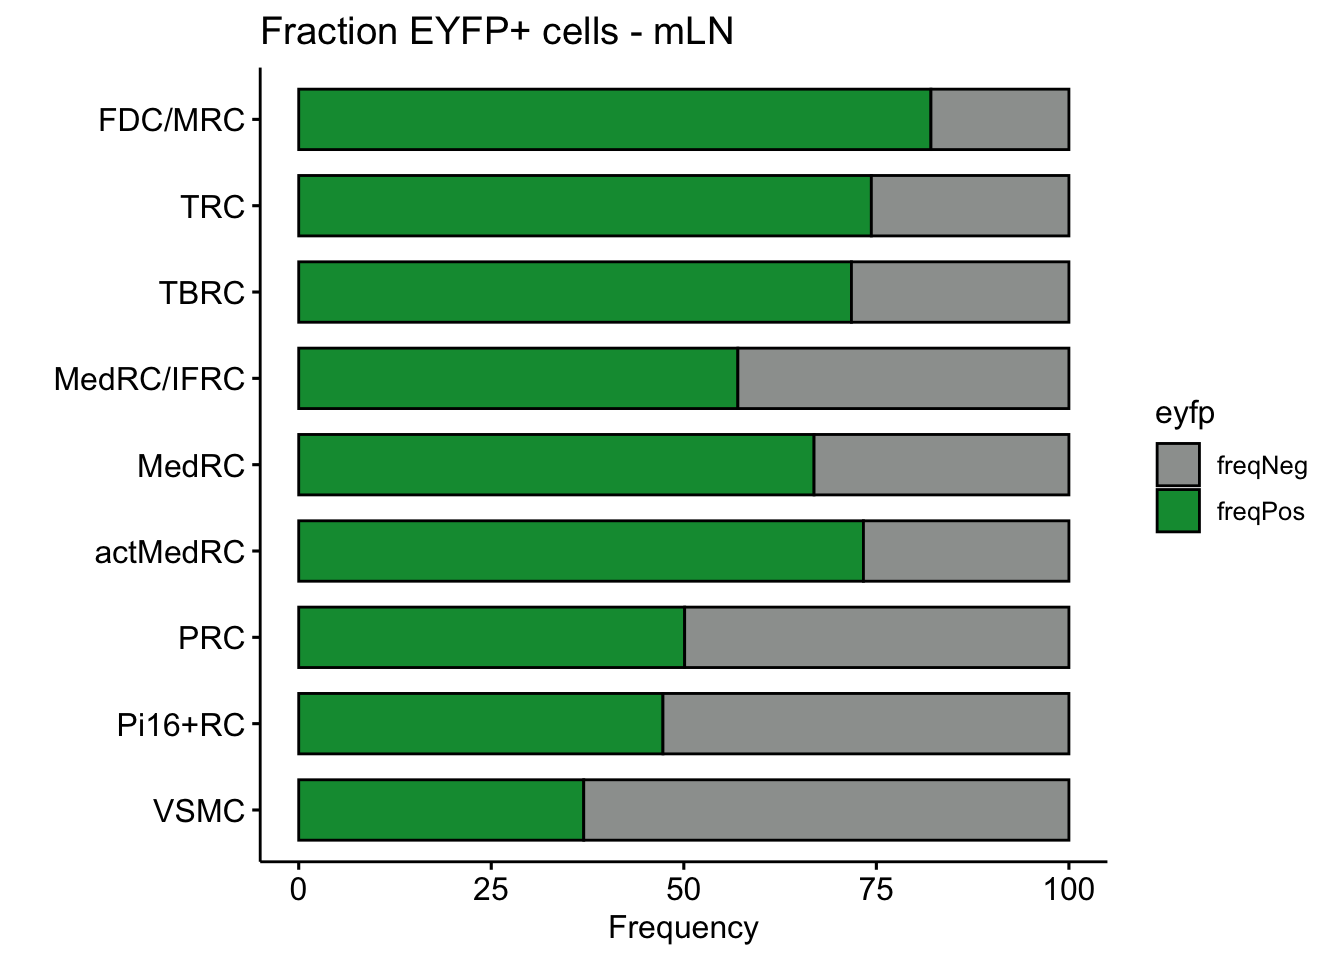
avgHeatmap <- function(seurat, selGenes, colVecIdent, colVecCond=NULL,
                       ordVec=NULL, gapVecR=NULL, gapVecC=NULL,cc=FALSE,
                       cr=FALSE, condCol=FALSE){

  selGenes <- selGenes$gene

  ## assay data
  clusterAssigned <- as.data.frame(Idents(seurat)) %>%
  dplyr::mutate(cell=rownames(.))
  colnames(clusterAssigned)[1] <- "ident"
  seuratDat <- GetAssayData(seurat)

  ## genes of interest
  genes <- data.frame(gene=rownames(seurat)) %>%
    mutate(geneID=gsub("^.*\\.", "", gene)) %>% filter(geneID %in% selGenes)

  ## matrix with averaged cnts per ident
  logNormExpres <- as.data.frame(t(as.matrix(
    seuratDat[which(rownames(seuratDat) %in% genes$gene),])))
  logNormExpres <- logNormExpres %>% dplyr::mutate(cell=rownames(.)) %>%
    dplyr::left_join(.,clusterAssigned, by=c("cell")) %>%
    dplyr::select(-cell) %>% dplyr::group_by(ident) %>%
    dplyr::summarise_all(mean)
  logNormExpresMa <- logNormExpres %>% dplyr::select(-ident) %>% as.matrix()
  rownames(logNormExpresMa) <- logNormExpres$ident
  logNormExpresMa <- t(logNormExpresMa)
  rownames(logNormExpresMa) <- gsub("^.*?\\.","",rownames(logNormExpresMa))

  ## remove genes if they are all the same in all groups
  ind <- apply(logNormExpresMa, 1, sd) == 0
  logNormExpresMa <- logNormExpresMa[!ind,]
  genes <- genes[!ind,]

  ## color columns according to cluster
  annotation_col <- as.data.frame(gsub("(^.*?_)","",
                                       colnames(logNormExpresMa)))%>%
    dplyr::mutate(celltype=gsub("(_.*$)","",colnames(logNormExpresMa)))
  colnames(annotation_col)[1] <- "col1"
  annotation_col <- annotation_col %>%
    dplyr::mutate(cond = gsub(".*_","",col1)) %>%
    dplyr::select(cond, celltype)
  rownames(annotation_col) <- colnames(logNormExpresMa)

  ann_colors = list(
      cond = colVecCond,
      celltype=colVecIdent)
  if(is.null(ann_colors$cond)){
    annotation_col$cond <- NULL
  }

  ## adjust order
  logNormExpresMa <- logNormExpresMa[selGenes,]
  if(is.null(ordVec)){
    ordVec <- levels(seurat)
  }
  logNormExpresMa <- logNormExpresMa[,ordVec]

  ## scaled row-wise
  pheatmap(logNormExpresMa, scale="row" ,treeheight_row = 0, cluster_rows = cr,
         cluster_cols = cc,
         color = colorRampPalette(c("#2166AC", "#F7F7F7", "#B2182B"))(50),
         annotation_col = annotation_col, cellwidth=15, cellheight=10,
         annotation_colors = ann_colors, gaps_row = gapVecR, gaps_col = gapVecC)
}
vis FRC marker
avg heatmap
seurat_markers <- data.frame(gene=c("Fcgr2b","Fcer2a","Cr2","Cxcl13",
                                    "Slc7a11", "Ccl19",
                                    "Ccl21a", "Fmod", "Grem1", "Bmp4",
                                    "Tnfsf11", "Fbn2",
                                    "Pltp" ,"C1rb", "Lepr", "Ptn",
                                     "Nr4a1", "Cxcl10", "Cxcl9",
                                    "F3", "Fbln1", "Gdf10", "Adamtsl1",
                                    "Col15a1",  "Cd34",
                                    "Igfbp6", "Pi16", "Thy1", "Dpp4", "Sema3c",
                                    "Acta2", "Myh11", "Mcam", "Itga7", "Esam", "Rgs4"
                                    ))

genes <- data.frame(geneID=rownames(seuratA.int)) %>%
  mutate(gene=gsub(".*\\.", "",  geneID))

markerAll <- seurat_markers %>% left_join(., genes, by="gene")

ordVec <- names(colLab)
Idents(seuratA.int) <- seuratA.int$label
pOut <- avgHeatmap(seurat = seuratA.int, selGenes = markerAll,
                  colVecIdent = colLab,
                  ordVec=ordVec,
                  gapVecR=NULL, gapVecC=NULL,cc=F,
                  cr=F, condCol=F)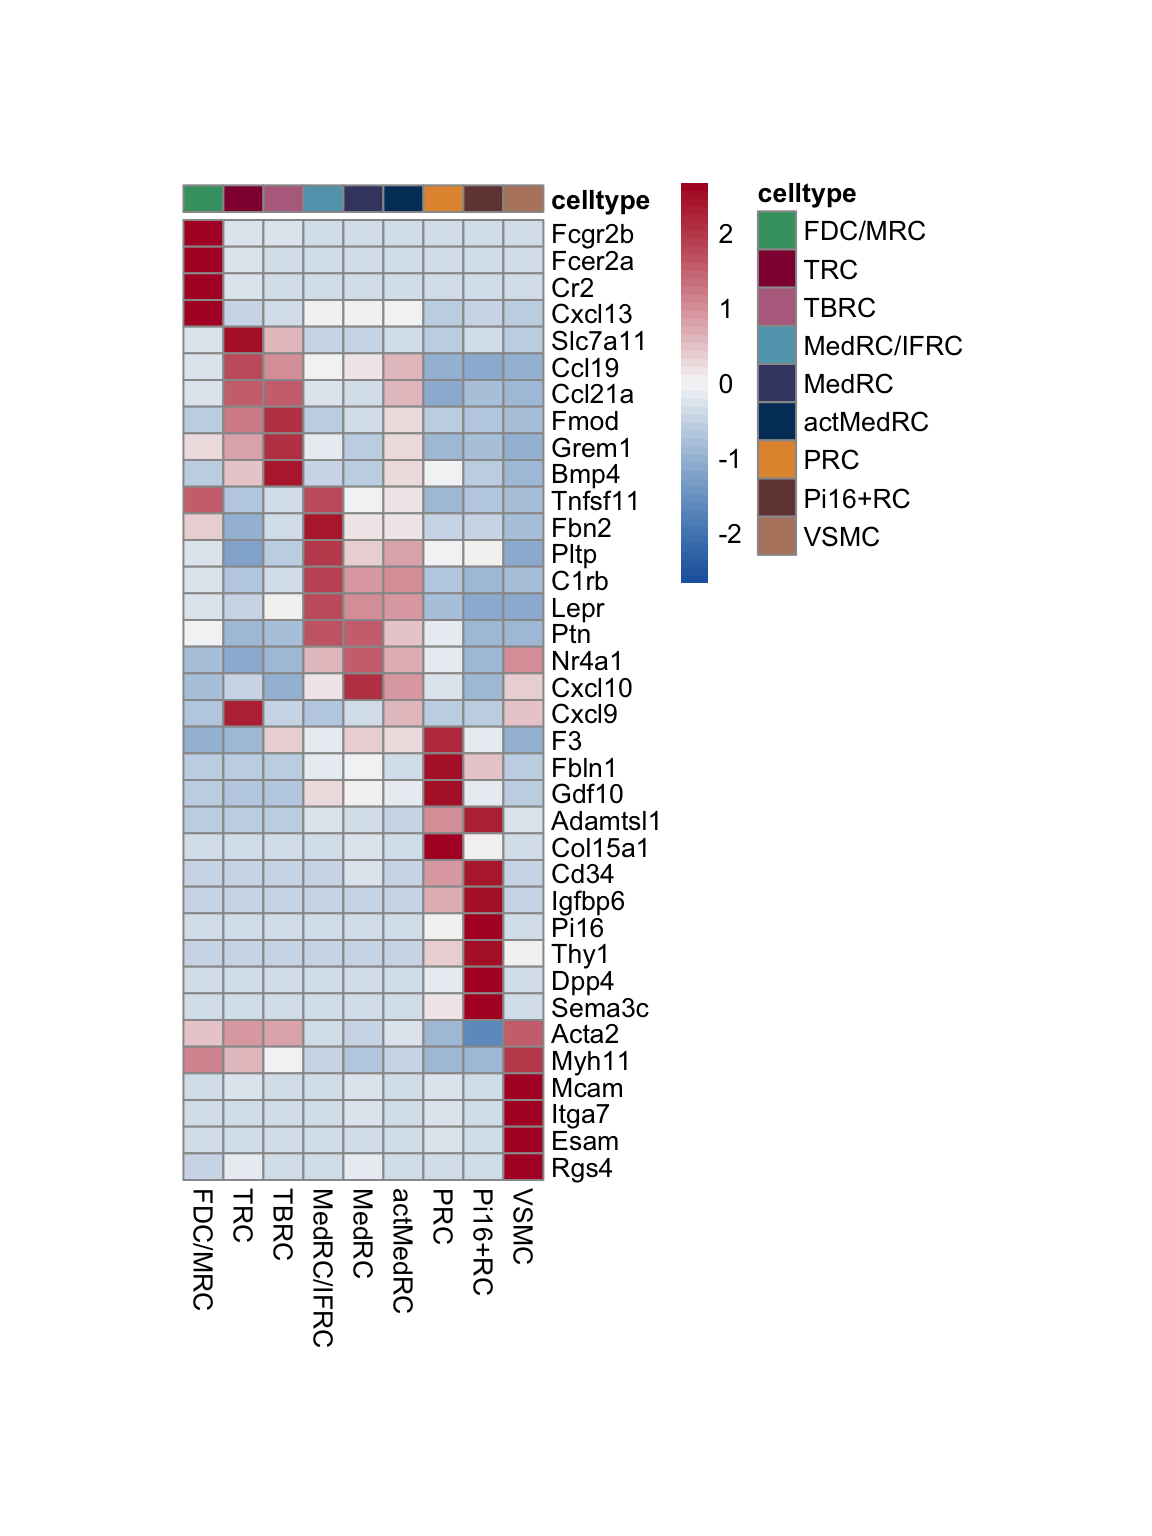
dotplot
## Dotplot all
seuratA.int$label <- factor(seuratA.int$label, levels = names(colLab))
Idents(seuratA.int) <- seuratA.int$label

DotPlot(seuratA.int, assay="RNA", features = rev(markerAll$geneID), scale =T,
        cluster.idents = F) +
  scale_color_viridis_c() +
  coord_flip() +
  theme(axis.text.x = element_text(angle = 90, hjust = 1)) +
  scale_x_discrete(breaks=rev(markerAll$geneID), labels=rev(markerAll$gene)) +
  xlab("") + ylab("")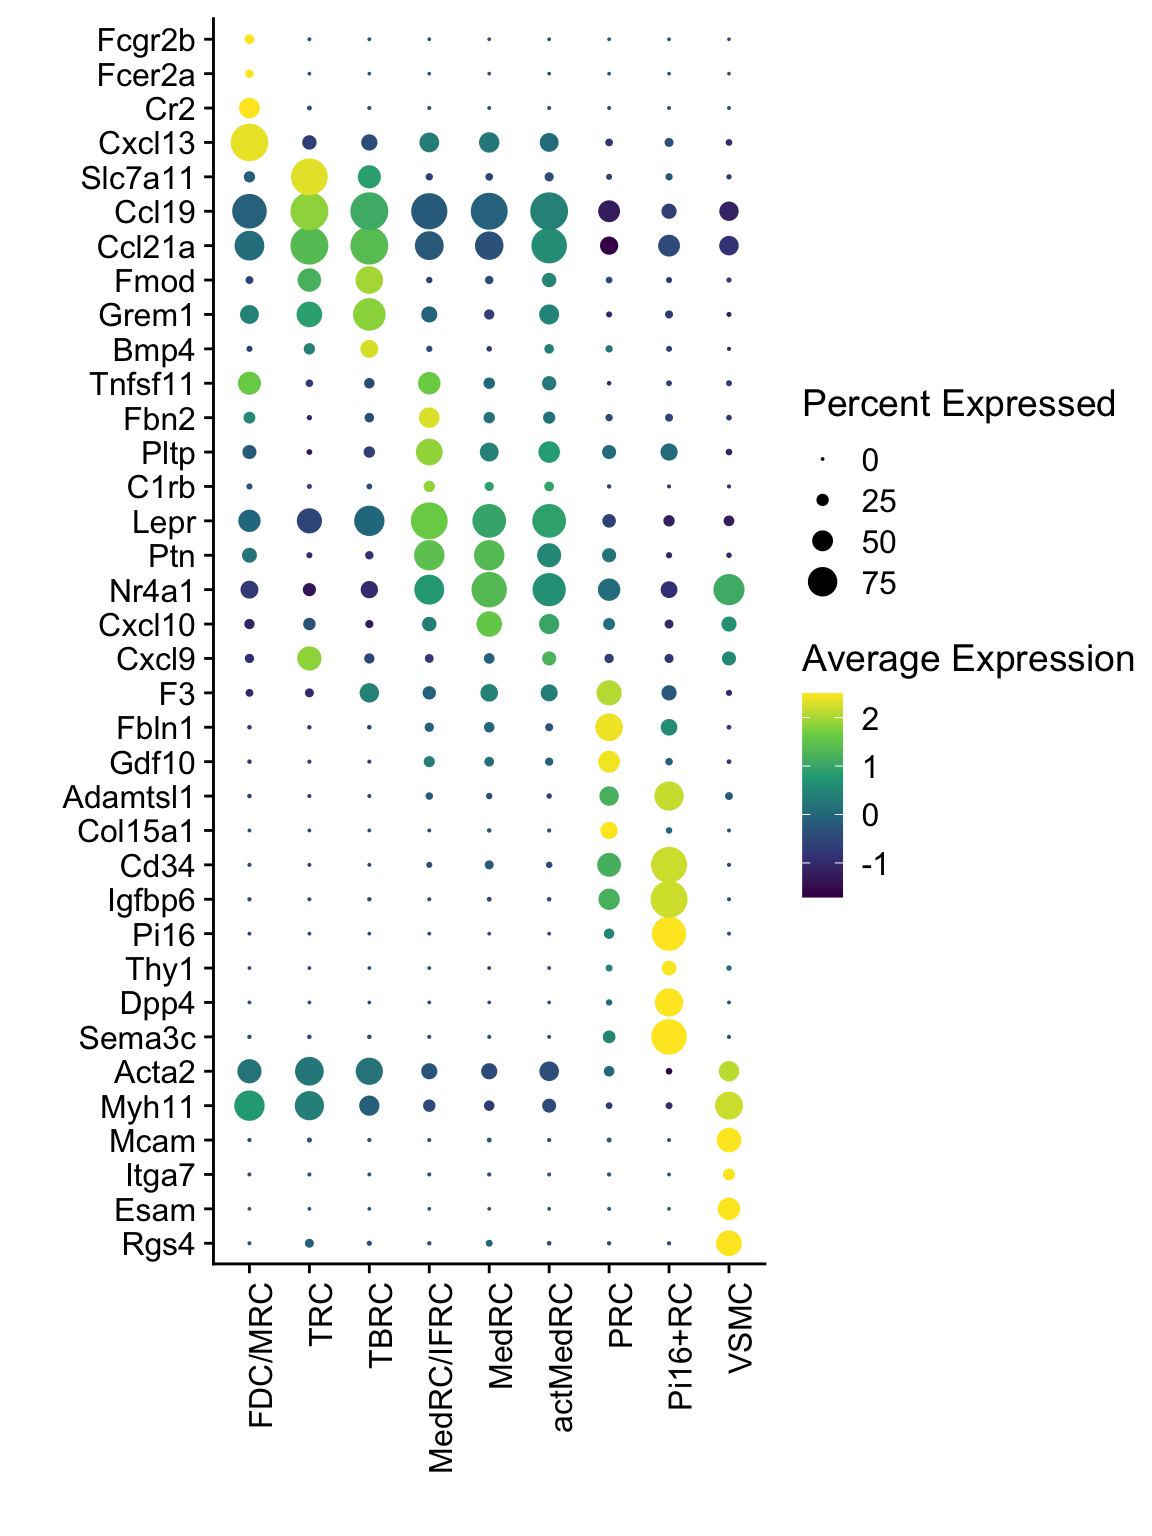
session info
date()[1] "Mon Jul 14 16:20:46 2025"sessionInfo()R version 4.4.0 (2024-04-24)
Platform: x86_64-apple-darwin20
Running under: macOS Ventura 13.7.6
Matrix products: default
BLAS: /Library/Frameworks/R.framework/Versions/4.4-x86_64/Resources/lib/libRblas.0.dylib
LAPACK: /Library/Frameworks/R.framework/Versions/4.4-x86_64/Resources/lib/libRlapack.dylib; LAPACK version 3.12.0
locale:
[1] en_US.UTF-8/en_US.UTF-8/en_US.UTF-8/C/en_US.UTF-8/en_US.UTF-8
time zone: Europe/Zurich
tzcode source: internal
attached base packages:
[1] grid stats4 stats graphics grDevices utils datasets methods base
other attached packages:
[1] here_1.0.1 NCmisc_1.2.0 VennDiagram_1.7.3
[4] futile.logger_1.4.3 ggupset_0.4.1 gridExtra_2.3
[7] DOSE_3.30.5 enrichplot_1.24.4 msigdbr_24.1.0
[10] org.Hs.eg.db_3.19.1 AnnotationDbi_1.66.0 clusterProfiler_4.12.6
[13] multtest_2.60.0 metap_1.12 scater_1.32.1
[16] scuttle_1.14.0 destiny_3.18.0 circlize_0.4.16
[19] muscat_1.18.0 viridis_0.6.5 viridisLite_0.4.2
[22] lubridate_1.9.4 forcats_1.0.0 stringr_1.5.1
[25] purrr_1.0.4 readr_2.1.5 tidyr_1.3.1
[28] tibble_3.2.1 tidyverse_2.0.0 dplyr_1.1.4
[31] SingleCellExperiment_1.26.0 SummarizedExperiment_1.34.0 Biobase_2.64.0
[34] GenomicRanges_1.56.2 GenomeInfoDb_1.40.1 IRanges_2.38.1
[37] S4Vectors_0.42.1 BiocGenerics_0.50.0 MatrixGenerics_1.16.0
[40] matrixStats_1.5.0 pheatmap_1.0.13 ggpubr_0.6.0
[43] ggplot2_3.5.2 Seurat_5.3.0 SeuratObject_5.1.0
[46] sp_2.2-0 runSeurat3_0.1.0 ExploreSCdataSeurat3_0.1.0
loaded via a namespace (and not attached):
[1] igraph_2.1.4 ica_1.0-3 plotly_4.10.4
[4] Formula_1.2-5 zlibbioc_1.50.0 tidyselect_1.2.1
[7] bit_4.6.0 doParallel_1.0.17 clue_0.3-66
[10] lattice_0.22-7 rjson_0.2.23 blob_1.2.4
[13] S4Arrays_1.4.1 pbkrtest_0.5.4 parallel_4.4.0
[16] png_0.1-8 plotrix_3.8-4 cli_3.6.5
[19] ggplotify_0.1.2 goftest_1.2-3 VIM_6.2.2
[22] variancePartition_1.34.0 BiocNeighbors_1.22.0 shadowtext_0.1.4
[25] uwot_0.2.3 curl_6.2.3 tidytree_0.4.6
[28] mime_0.13 evaluate_1.0.3 ComplexHeatmap_2.20.0
[31] stringi_1.8.7 backports_1.5.0 lmerTest_3.1-3
[34] qqconf_1.3.2 httpuv_1.6.16 magrittr_2.0.3
[37] rappdirs_0.3.3 splines_4.4.0 ggraph_2.2.1
[40] sctransform_0.4.2 ggbeeswarm_0.7.2 DBI_1.2.3
[43] jquerylib_0.1.4 smoother_1.3 withr_3.0.2
[46] git2r_0.36.2 corpcor_1.6.10 reformulas_0.4.1
[49] class_7.3-23 rprojroot_2.0.4 lmtest_0.9-40
[52] tidygraph_1.3.1 formatR_1.14 colourpicker_1.3.0
[55] htmlwidgets_1.6.4 fs_1.6.6 ggrepel_0.9.6
[58] labeling_0.4.3 fANCOVA_0.6-1 SparseArray_1.4.8
[61] DESeq2_1.44.0 ranger_0.17.0 DEoptimR_1.1-3-1
[64] reticulate_1.42.0 hexbin_1.28.5 zoo_1.8-14
[67] XVector_0.44.0 knitr_1.50 ggplot.multistats_1.0.1
[70] UCSC.utils_1.0.0 RhpcBLASctl_0.23-42 timechange_0.3.0
[73] foreach_1.5.2 patchwork_1.3.0 caTools_1.18.3
[76] ggtree_3.12.0 data.table_1.17.4 R.oo_1.27.1
[79] RSpectra_0.16-2 irlba_2.3.5.1 gridGraphics_0.5-1
[82] fastDummies_1.7.5 lazyeval_0.2.2 yaml_2.3.10
[85] survival_3.8-3 scattermore_1.2 crayon_1.5.3
[88] RcppAnnoy_0.0.22 RColorBrewer_1.1-3 progressr_0.15.1
[91] tweenr_2.0.3 later_1.4.2 ggridges_0.5.6
[94] codetools_0.2-20 GlobalOptions_0.1.2 aod_1.3.3
[97] KEGGREST_1.44.1 Rtsne_0.17 shape_1.4.6.1
[100] limma_3.60.6 pkgconfig_2.0.3 TMB_1.9.17
[103] spatstat.univar_3.1-3 mathjaxr_1.8-0 EnvStats_3.1.0
[106] aplot_0.2.5 scatterplot3d_0.3-44 ape_5.8-1
[109] spatstat.sparse_3.1-0 xtable_1.8-4 car_3.1-3
[112] plyr_1.8.9 httr_1.4.7 rbibutils_2.3
[115] tools_4.4.0 globals_0.18.0 beeswarm_0.4.0
[118] broom_1.0.8 nlme_3.1-168 lambda.r_1.2.4
[121] assertthat_0.2.1 lme4_1.1-37 digest_0.6.37
[124] numDeriv_2016.8-1.1 Matrix_1.7-3 farver_2.1.2
[127] tzdb_0.5.0 remaCor_0.0.18 reshape2_1.4.4
[130] yulab.utils_0.2.0 glue_1.8.0 cachem_1.1.0
[133] polyclip_1.10-7 generics_0.1.4 Biostrings_2.72.1
[136] mvtnorm_1.3-3 parallelly_1.45.0 mnormt_2.1.1
[139] statmod_1.5.0 RcppHNSW_0.6.0 ScaledMatrix_1.12.0
[142] carData_3.0-5 minqa_1.2.8 pbapply_1.7-2
[145] httr2_1.1.2 spam_2.11-1 gson_0.1.0
[148] graphlayouts_1.2.2 gtools_3.9.5 ggsignif_0.6.4
[151] RcppEigen_0.3.4.0.2 shiny_1.10.0 GenomeInfoDbData_1.2.12
[154] glmmTMB_1.1.11 R.utils_2.13.0 memoise_2.0.1
[157] rmarkdown_2.29 scales_1.4.0 R.methodsS3_1.8.2
[160] future_1.58.0 RANN_2.6.2 Cairo_1.6-2
[163] spatstat.data_3.1-6 rstudioapi_0.17.1 cluster_2.1.8.1
[166] whisker_0.4.1 mutoss_0.1-13 spatstat.utils_3.1-4
[169] hms_1.1.3 fitdistrplus_1.2-2 cowplot_1.1.3
[172] colorspace_2.1-1 rlang_1.1.6 DelayedMatrixStats_1.26.0
[175] sparseMatrixStats_1.16.0 xts_0.14.1 dotCall64_1.2
[178] shinydashboard_0.7.3 ggforce_0.4.2 laeken_0.5.3
[181] mgcv_1.9-3 xfun_0.52 e1071_1.7-16
[184] TH.data_1.1-3 iterators_1.0.14 abind_1.4-8
[187] GOSemSim_2.30.2 treeio_1.28.0 futile.options_1.0.1
[190] bitops_1.0-9 Rdpack_2.6.4 promises_1.3.3
[193] scatterpie_0.2.4 RSQLite_2.4.0 qvalue_2.36.0
[196] sandwich_3.1-1 fgsea_1.30.0 DelayedArray_0.30.1
[199] proxy_0.4-27 GO.db_3.19.1 compiler_4.4.0
[202] prettyunits_1.2.0 boot_1.3-31 beachmat_2.20.0
[205] listenv_0.9.1 Rcpp_1.0.14 edgeR_4.2.2
[208] workflowr_1.7.1 BiocSingular_1.20.0 tensor_1.5
[211] MASS_7.3-65 progress_1.2.3 BiocParallel_1.38.0
[214] babelgene_22.9 spatstat.random_3.4-1 R6_2.6.1
[217] fastmap_1.2.0 multcomp_1.4-28 fastmatch_1.1-6
[220] rstatix_0.7.2 vipor_0.4.7 TTR_0.24.4
[223] ROCR_1.0-11 TFisher_0.2.0 rsvd_1.0.5
[226] vcd_1.4-13 nnet_7.3-20 gtable_0.3.6
[229] KernSmooth_2.23-26 miniUI_0.1.2 deldir_2.0-4
[232] htmltools_0.5.8.1 ggthemes_5.1.0 bit64_4.6.0-1
[235] spatstat.explore_3.4-3 lifecycle_1.0.4 blme_1.0-6
[238] nloptr_2.2.1 sass_0.4.10 vctrs_0.6.5
[241] robustbase_0.99-4-1 spatstat.geom_3.4-1 sn_2.1.1
[244] ggfun_0.1.8 future.apply_1.11.3 bslib_0.9.0
[247] pillar_1.10.2 gplots_3.2.0 pcaMethods_1.96.0
[250] locfit_1.5-9.12 jsonlite_2.0.0 GetoptLong_1.0.5
sessionInfo()R version 4.4.0 (2024-04-24)
Platform: x86_64-apple-darwin20
Running under: macOS Ventura 13.7.6
Matrix products: default
BLAS: /Library/Frameworks/R.framework/Versions/4.4-x86_64/Resources/lib/libRblas.0.dylib
LAPACK: /Library/Frameworks/R.framework/Versions/4.4-x86_64/Resources/lib/libRlapack.dylib; LAPACK version 3.12.0
locale:
[1] en_US.UTF-8/en_US.UTF-8/en_US.UTF-8/C/en_US.UTF-8/en_US.UTF-8
time zone: Europe/Zurich
tzcode source: internal
attached base packages:
[1] grid stats4 stats graphics grDevices utils datasets methods base
other attached packages:
[1] here_1.0.1 NCmisc_1.2.0 VennDiagram_1.7.3
[4] futile.logger_1.4.3 ggupset_0.4.1 gridExtra_2.3
[7] DOSE_3.30.5 enrichplot_1.24.4 msigdbr_24.1.0
[10] org.Hs.eg.db_3.19.1 AnnotationDbi_1.66.0 clusterProfiler_4.12.6
[13] multtest_2.60.0 metap_1.12 scater_1.32.1
[16] scuttle_1.14.0 destiny_3.18.0 circlize_0.4.16
[19] muscat_1.18.0 viridis_0.6.5 viridisLite_0.4.2
[22] lubridate_1.9.4 forcats_1.0.0 stringr_1.5.1
[25] purrr_1.0.4 readr_2.1.5 tidyr_1.3.1
[28] tibble_3.2.1 tidyverse_2.0.0 dplyr_1.1.4
[31] SingleCellExperiment_1.26.0 SummarizedExperiment_1.34.0 Biobase_2.64.0
[34] GenomicRanges_1.56.2 GenomeInfoDb_1.40.1 IRanges_2.38.1
[37] S4Vectors_0.42.1 BiocGenerics_0.50.0 MatrixGenerics_1.16.0
[40] matrixStats_1.5.0 pheatmap_1.0.13 ggpubr_0.6.0
[43] ggplot2_3.5.2 Seurat_5.3.0 SeuratObject_5.1.0
[46] sp_2.2-0 runSeurat3_0.1.0 ExploreSCdataSeurat3_0.1.0
loaded via a namespace (and not attached):
[1] igraph_2.1.4 ica_1.0-3 plotly_4.10.4
[4] Formula_1.2-5 zlibbioc_1.50.0 tidyselect_1.2.1
[7] bit_4.6.0 doParallel_1.0.17 clue_0.3-66
[10] lattice_0.22-7 rjson_0.2.23 blob_1.2.4
[13] S4Arrays_1.4.1 pbkrtest_0.5.4 parallel_4.4.0
[16] png_0.1-8 plotrix_3.8-4 cli_3.6.5
[19] ggplotify_0.1.2 goftest_1.2-3 VIM_6.2.2
[22] variancePartition_1.34.0 BiocNeighbors_1.22.0 shadowtext_0.1.4
[25] uwot_0.2.3 curl_6.2.3 tidytree_0.4.6
[28] mime_0.13 evaluate_1.0.3 ComplexHeatmap_2.20.0
[31] stringi_1.8.7 backports_1.5.0 lmerTest_3.1-3
[34] qqconf_1.3.2 httpuv_1.6.16 magrittr_2.0.3
[37] rappdirs_0.3.3 splines_4.4.0 ggraph_2.2.1
[40] sctransform_0.4.2 ggbeeswarm_0.7.2 DBI_1.2.3
[43] jquerylib_0.1.4 smoother_1.3 withr_3.0.2
[46] git2r_0.36.2 corpcor_1.6.10 reformulas_0.4.1
[49] class_7.3-23 rprojroot_2.0.4 lmtest_0.9-40
[52] tidygraph_1.3.1 formatR_1.14 colourpicker_1.3.0
[55] htmlwidgets_1.6.4 fs_1.6.6 ggrepel_0.9.6
[58] labeling_0.4.3 fANCOVA_0.6-1 SparseArray_1.4.8
[61] DESeq2_1.44.0 ranger_0.17.0 DEoptimR_1.1-3-1
[64] reticulate_1.42.0 hexbin_1.28.5 zoo_1.8-14
[67] XVector_0.44.0 knitr_1.50 ggplot.multistats_1.0.1
[70] UCSC.utils_1.0.0 RhpcBLASctl_0.23-42 timechange_0.3.0
[73] foreach_1.5.2 patchwork_1.3.0 caTools_1.18.3
[76] ggtree_3.12.0 data.table_1.17.4 R.oo_1.27.1
[79] RSpectra_0.16-2 irlba_2.3.5.1 gridGraphics_0.5-1
[82] fastDummies_1.7.5 lazyeval_0.2.2 yaml_2.3.10
[85] survival_3.8-3 scattermore_1.2 crayon_1.5.3
[88] RcppAnnoy_0.0.22 RColorBrewer_1.1-3 progressr_0.15.1
[91] tweenr_2.0.3 later_1.4.2 ggridges_0.5.6
[94] codetools_0.2-20 GlobalOptions_0.1.2 aod_1.3.3
[97] KEGGREST_1.44.1 Rtsne_0.17 shape_1.4.6.1
[100] limma_3.60.6 pkgconfig_2.0.3 TMB_1.9.17
[103] spatstat.univar_3.1-3 mathjaxr_1.8-0 EnvStats_3.1.0
[106] aplot_0.2.5 scatterplot3d_0.3-44 ape_5.8-1
[109] spatstat.sparse_3.1-0 xtable_1.8-4 car_3.1-3
[112] plyr_1.8.9 httr_1.4.7 rbibutils_2.3
[115] tools_4.4.0 globals_0.18.0 beeswarm_0.4.0
[118] broom_1.0.8 nlme_3.1-168 lambda.r_1.2.4
[121] assertthat_0.2.1 lme4_1.1-37 digest_0.6.37
[124] numDeriv_2016.8-1.1 Matrix_1.7-3 farver_2.1.2
[127] tzdb_0.5.0 remaCor_0.0.18 reshape2_1.4.4
[130] yulab.utils_0.2.0 glue_1.8.0 cachem_1.1.0
[133] polyclip_1.10-7 generics_0.1.4 Biostrings_2.72.1
[136] mvtnorm_1.3-3 parallelly_1.45.0 mnormt_2.1.1
[139] statmod_1.5.0 RcppHNSW_0.6.0 ScaledMatrix_1.12.0
[142] carData_3.0-5 minqa_1.2.8 pbapply_1.7-2
[145] httr2_1.1.2 spam_2.11-1 gson_0.1.0
[148] graphlayouts_1.2.2 gtools_3.9.5 ggsignif_0.6.4
[151] RcppEigen_0.3.4.0.2 shiny_1.10.0 GenomeInfoDbData_1.2.12
[154] glmmTMB_1.1.11 R.utils_2.13.0 memoise_2.0.1
[157] rmarkdown_2.29 scales_1.4.0 R.methodsS3_1.8.2
[160] future_1.58.0 RANN_2.6.2 Cairo_1.6-2
[163] spatstat.data_3.1-6 rstudioapi_0.17.1 cluster_2.1.8.1
[166] whisker_0.4.1 mutoss_0.1-13 spatstat.utils_3.1-4
[169] hms_1.1.3 fitdistrplus_1.2-2 cowplot_1.1.3
[172] colorspace_2.1-1 rlang_1.1.6 DelayedMatrixStats_1.26.0
[175] sparseMatrixStats_1.16.0 xts_0.14.1 dotCall64_1.2
[178] shinydashboard_0.7.3 ggforce_0.4.2 laeken_0.5.3
[181] mgcv_1.9-3 xfun_0.52 e1071_1.7-16
[184] TH.data_1.1-3 iterators_1.0.14 abind_1.4-8
[187] GOSemSim_2.30.2 treeio_1.28.0 futile.options_1.0.1
[190] bitops_1.0-9 Rdpack_2.6.4 promises_1.3.3
[193] scatterpie_0.2.4 RSQLite_2.4.0 qvalue_2.36.0
[196] sandwich_3.1-1 fgsea_1.30.0 DelayedArray_0.30.1
[199] proxy_0.4-27 GO.db_3.19.1 compiler_4.4.0
[202] prettyunits_1.2.0 boot_1.3-31 beachmat_2.20.0
[205] listenv_0.9.1 Rcpp_1.0.14 edgeR_4.2.2
[208] workflowr_1.7.1 BiocSingular_1.20.0 tensor_1.5
[211] MASS_7.3-65 progress_1.2.3 BiocParallel_1.38.0
[214] babelgene_22.9 spatstat.random_3.4-1 R6_2.6.1
[217] fastmap_1.2.0 multcomp_1.4-28 fastmatch_1.1-6
[220] rstatix_0.7.2 vipor_0.4.7 TTR_0.24.4
[223] ROCR_1.0-11 TFisher_0.2.0 rsvd_1.0.5
[226] vcd_1.4-13 nnet_7.3-20 gtable_0.3.6
[229] KernSmooth_2.23-26 miniUI_0.1.2 deldir_2.0-4
[232] htmltools_0.5.8.1 ggthemes_5.1.0 bit64_4.6.0-1
[235] spatstat.explore_3.4-3 lifecycle_1.0.4 blme_1.0-6
[238] nloptr_2.2.1 sass_0.4.10 vctrs_0.6.5
[241] robustbase_0.99-4-1 spatstat.geom_3.4-1 sn_2.1.1
[244] ggfun_0.1.8 future.apply_1.11.3 bslib_0.9.0
[247] pillar_1.10.2 gplots_3.2.0 pcaMethods_1.96.0
[250] locfit_1.5-9.12 jsonlite_2.0.0 GetoptLong_1.0.5